Analyse initiatives in list views to quickly identify and extract key information. Initiative lists include:
My Worklist - to quickly access initiatives assigned to you for action
All initiatives - analyse summary information of all initiatives that you are authorised to access
Initiative Analytics - analyse summary and preferred option information of authorised initiatives
Key Concepts
The analysis grids provide useful features for generating reports and charts related to initiatives.
The initiatives which are visible to a user are based on their involvement and assigned authorization groups.
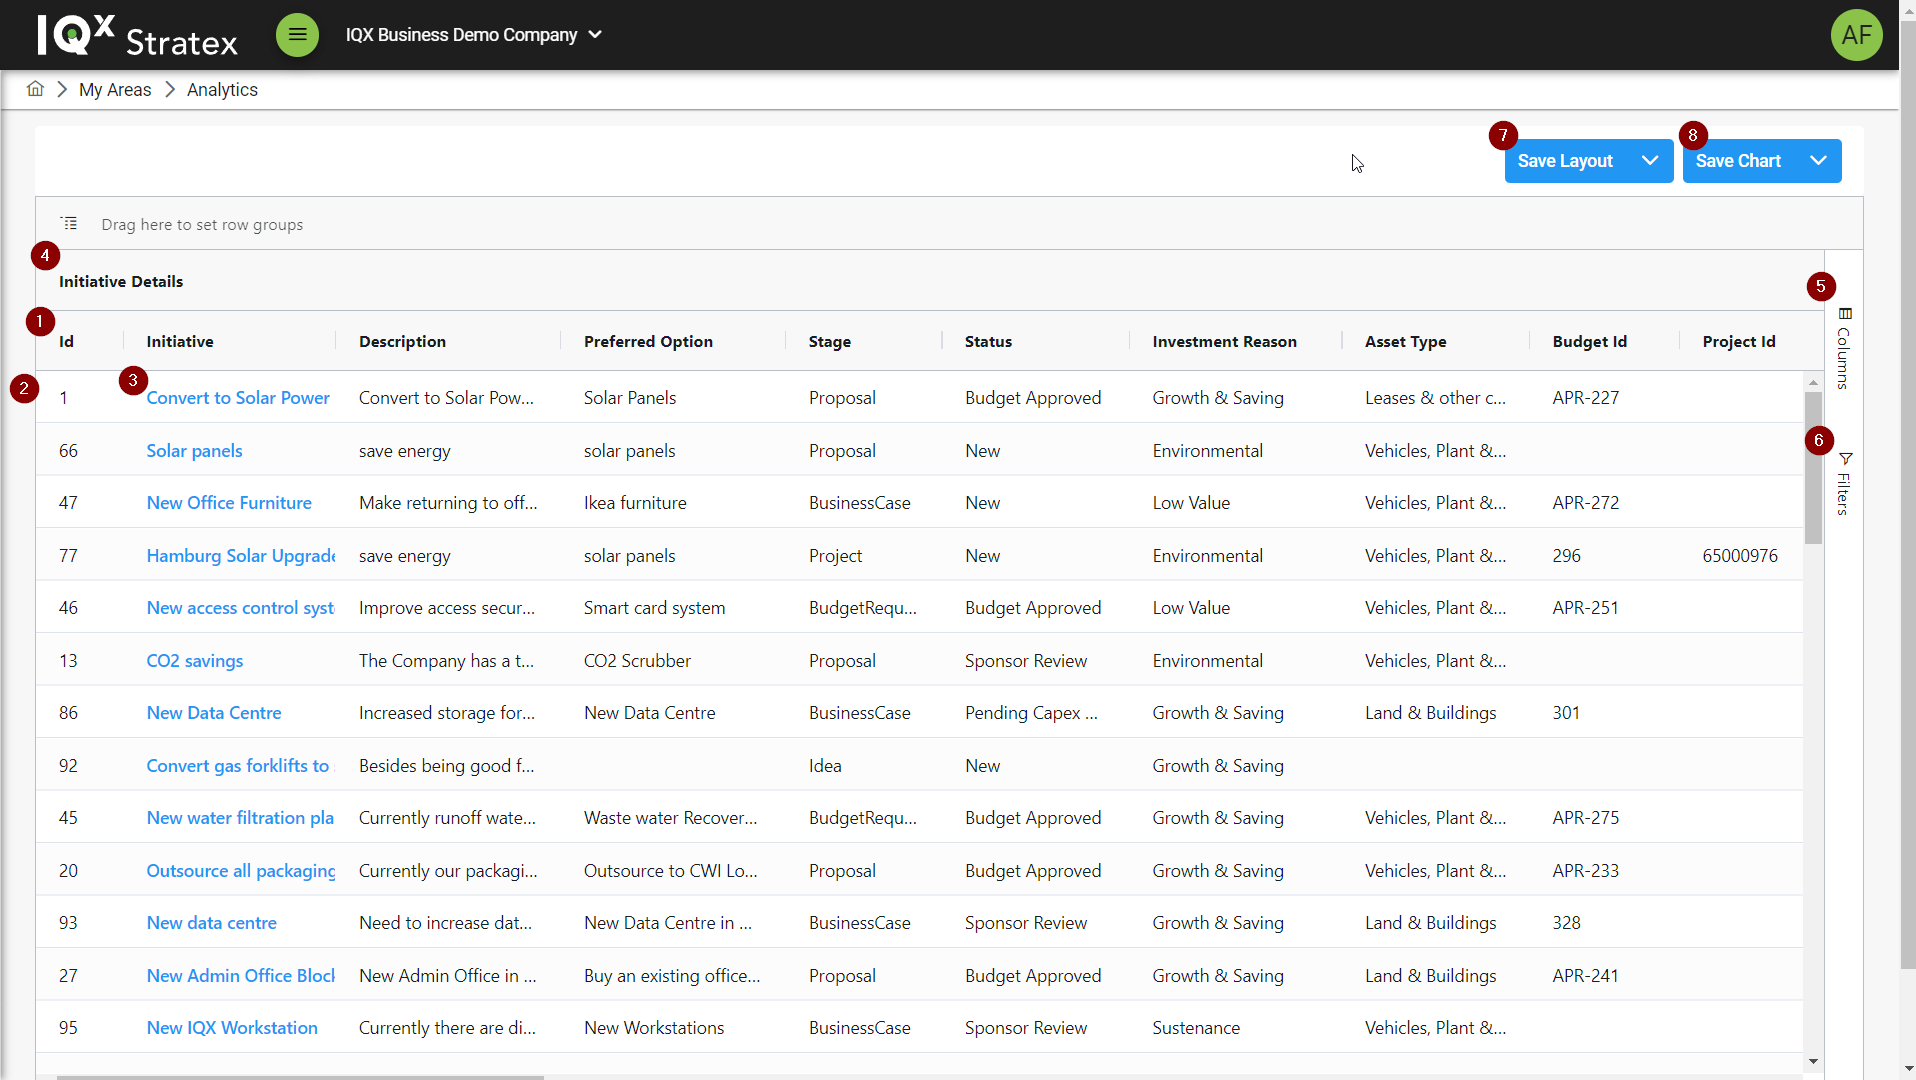
The analytics page consists of the following key features:
Columns - Related to initiative data fields or attributes
Rows - Each initiatives is reflected in a single row
Data Cells - The cross section of an initiative and its data field or attribute
Column Groups - The grouping of related columns together
Column configuration - Provides the ability to customise columns based on personal preference
Filters - Displaying only the rows that meet certain conditions
Layouts - Save and load layouts based on custom column and filter configurations
Charts - Save and load created charts
Extracts - Analysis grids can be exported for further analysis
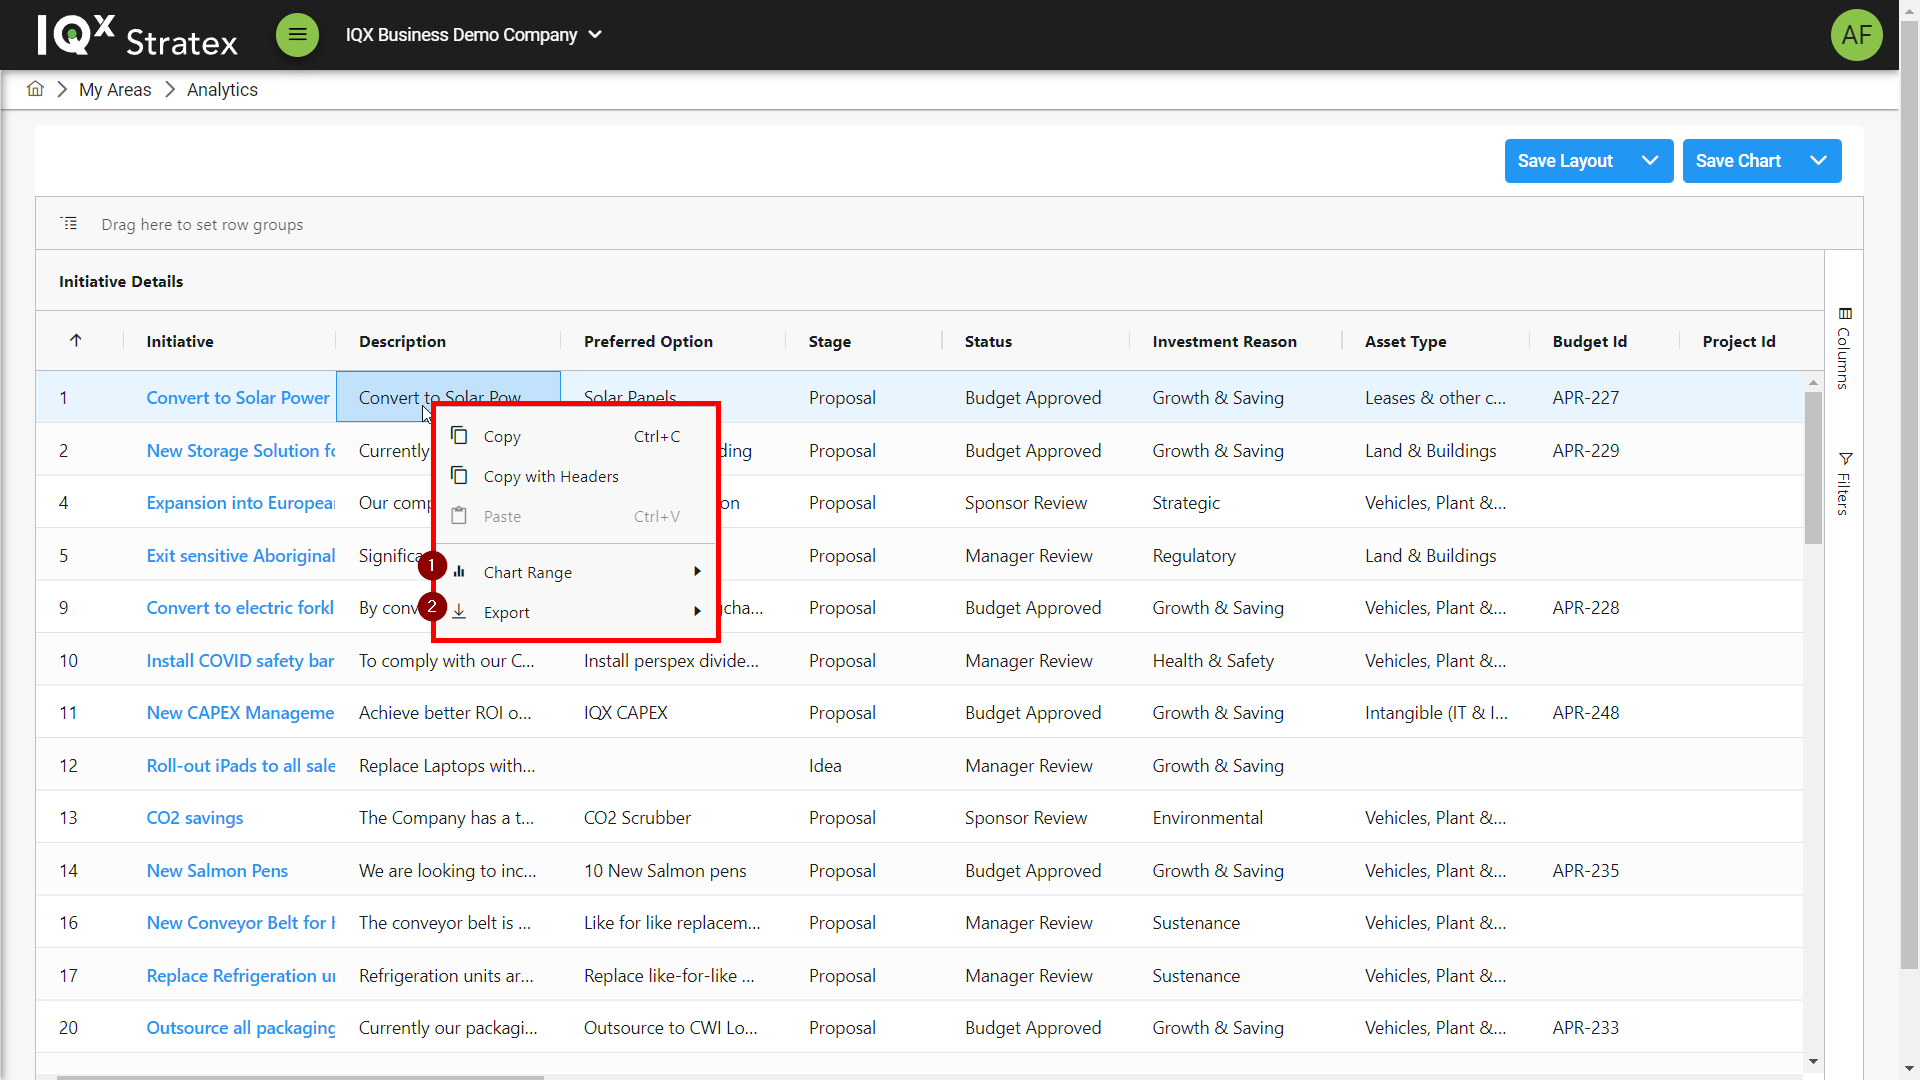
Data actions
When a cell or group of cells is selected, right clicking will bring up the action menu
The main actions that can be taken are:
Creating a chart
Exporting data
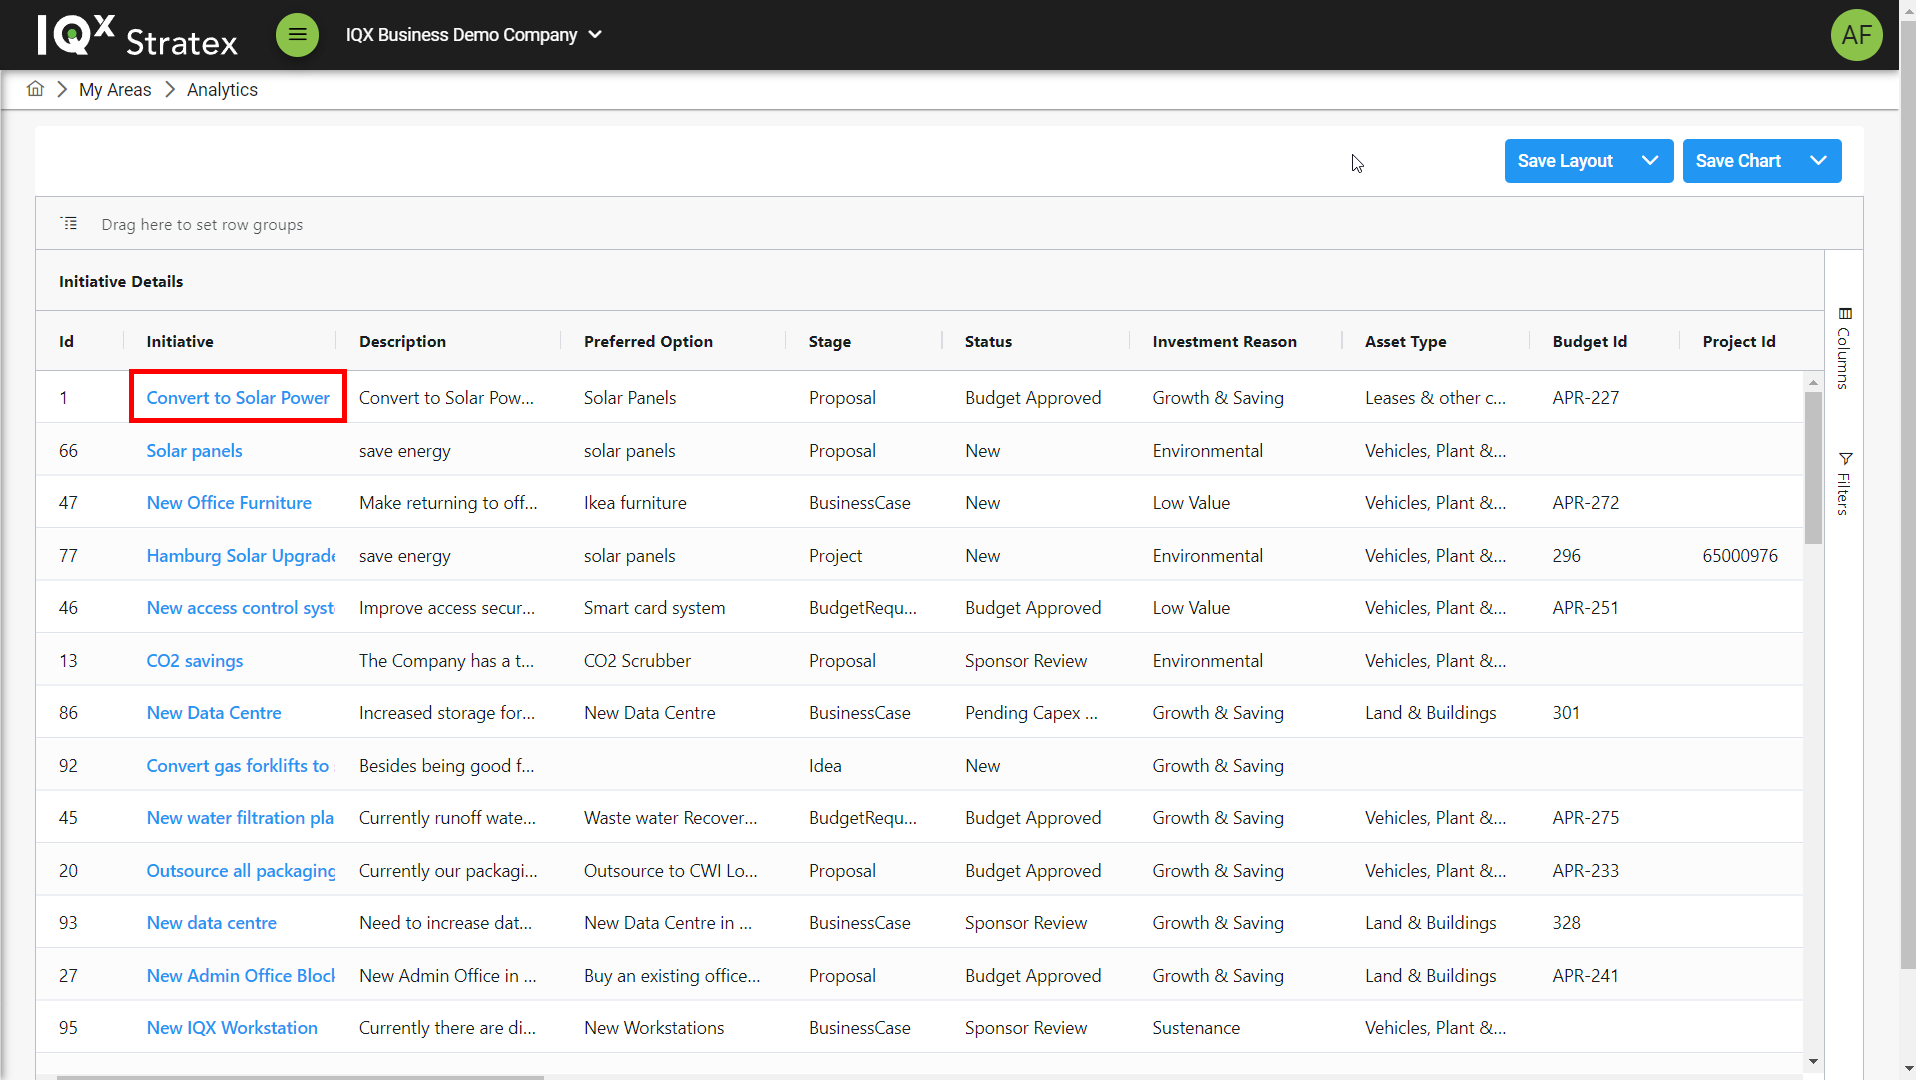
The user can also access the full initiative by clicking the hyperlink on the Initiative Name.
Layouts
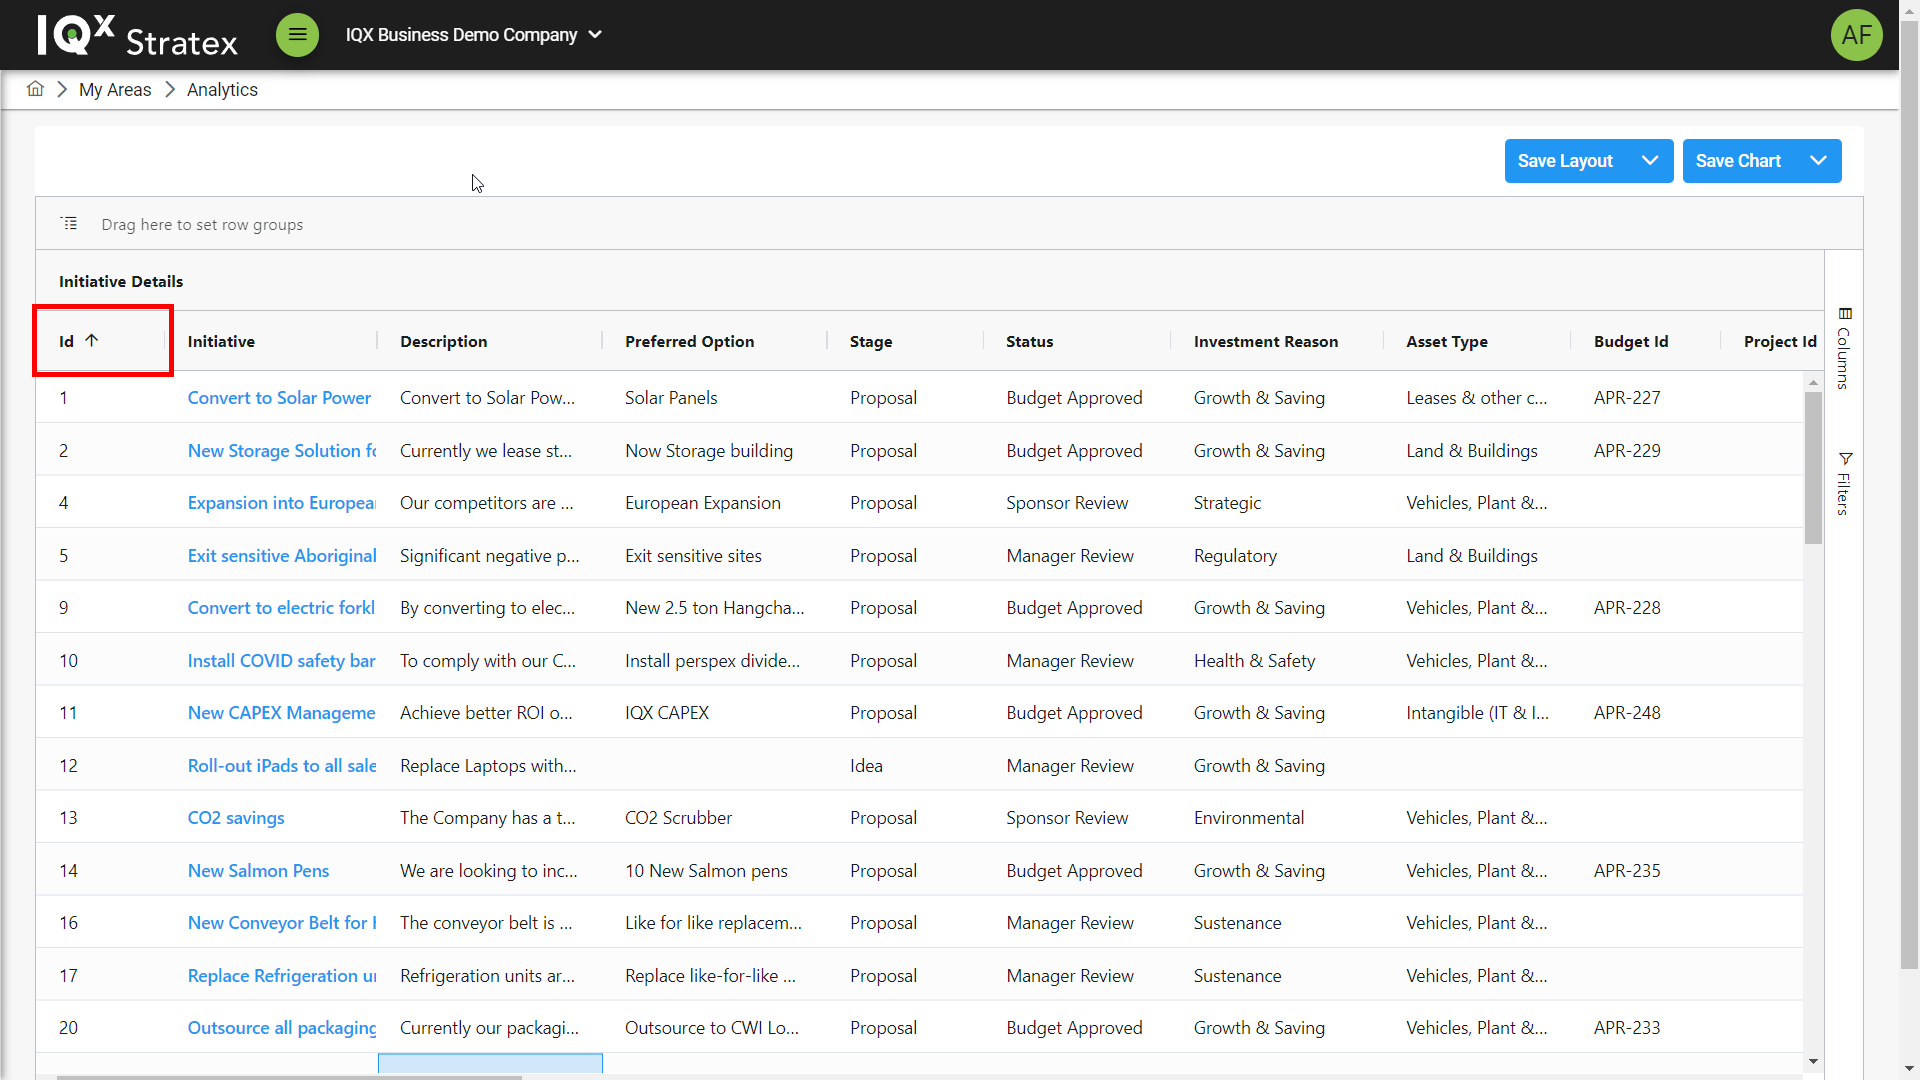
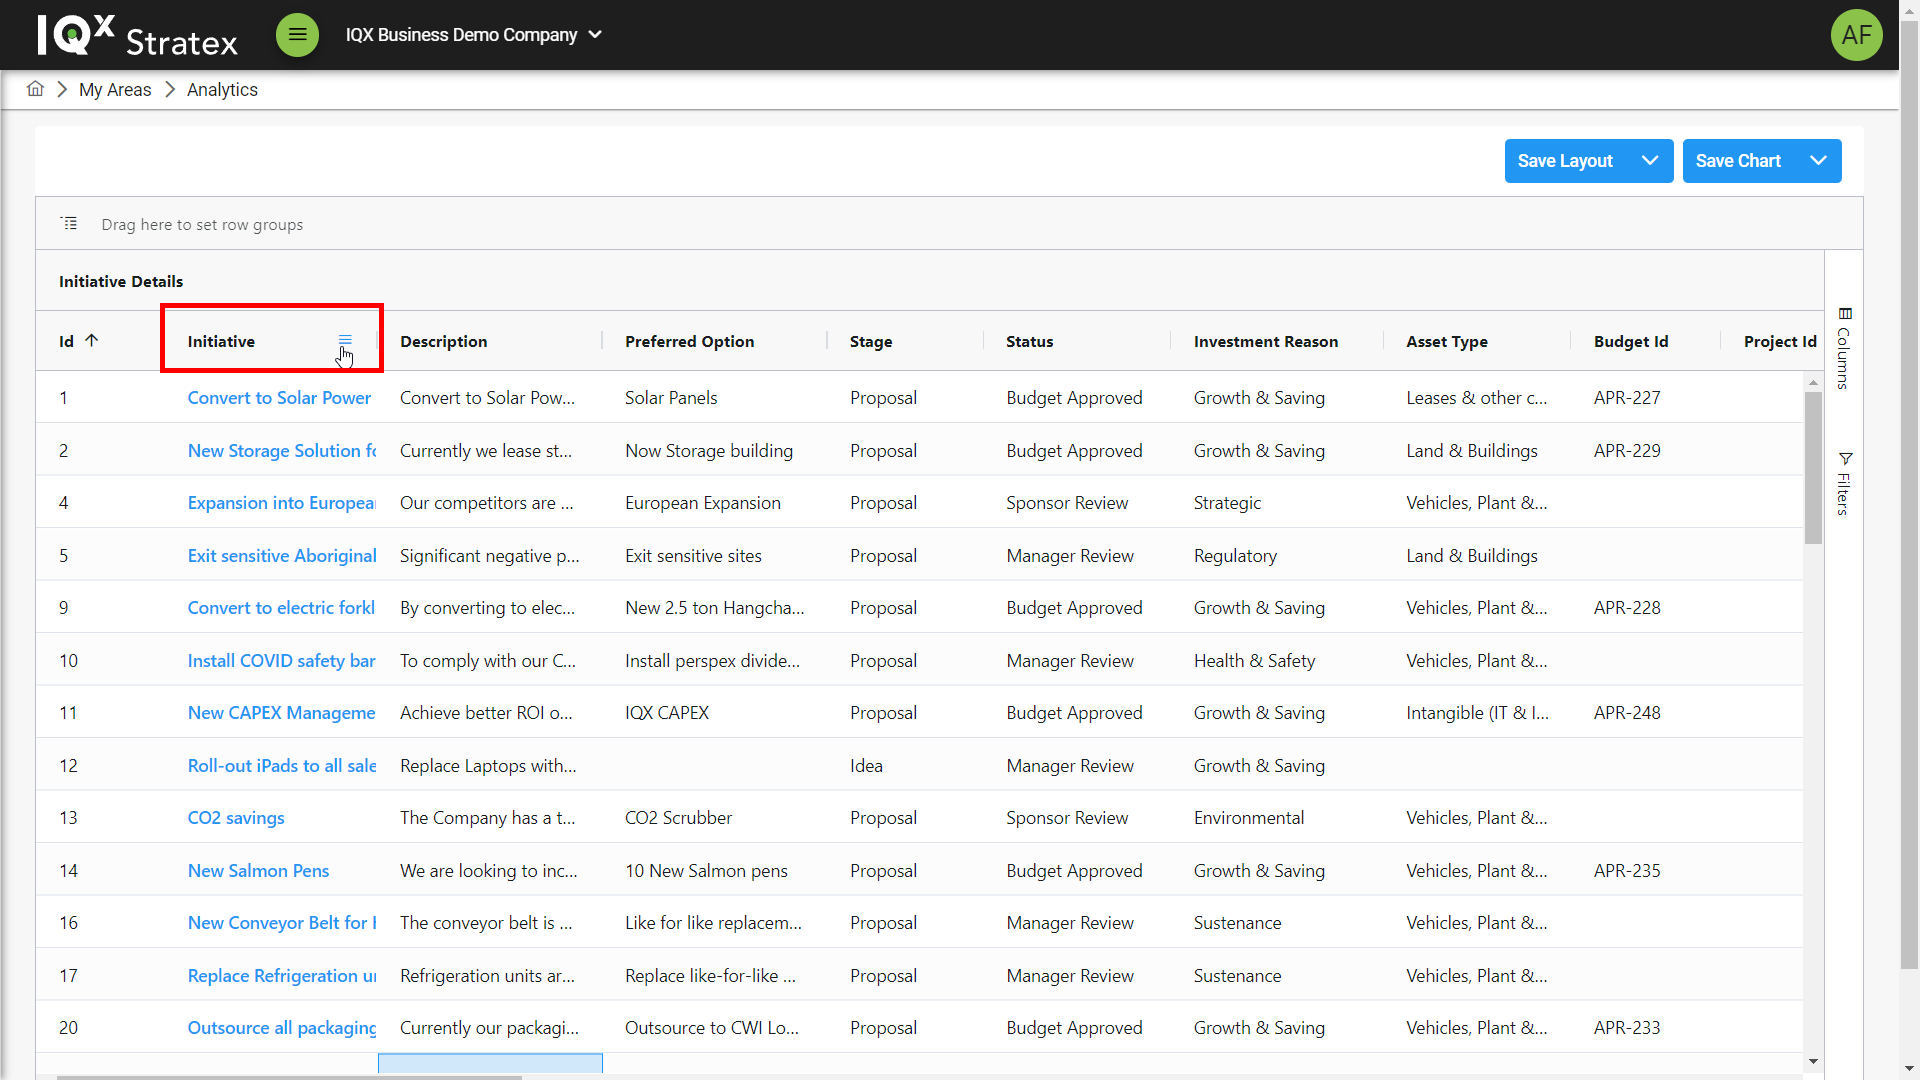
Sorting columns
Clicking on a column header will sort all rows based on data in that column based on alphanumerical value.
Clicking the column header again will cause it to alternate between ascending and descending order with the icon on the header indicating sorting order.
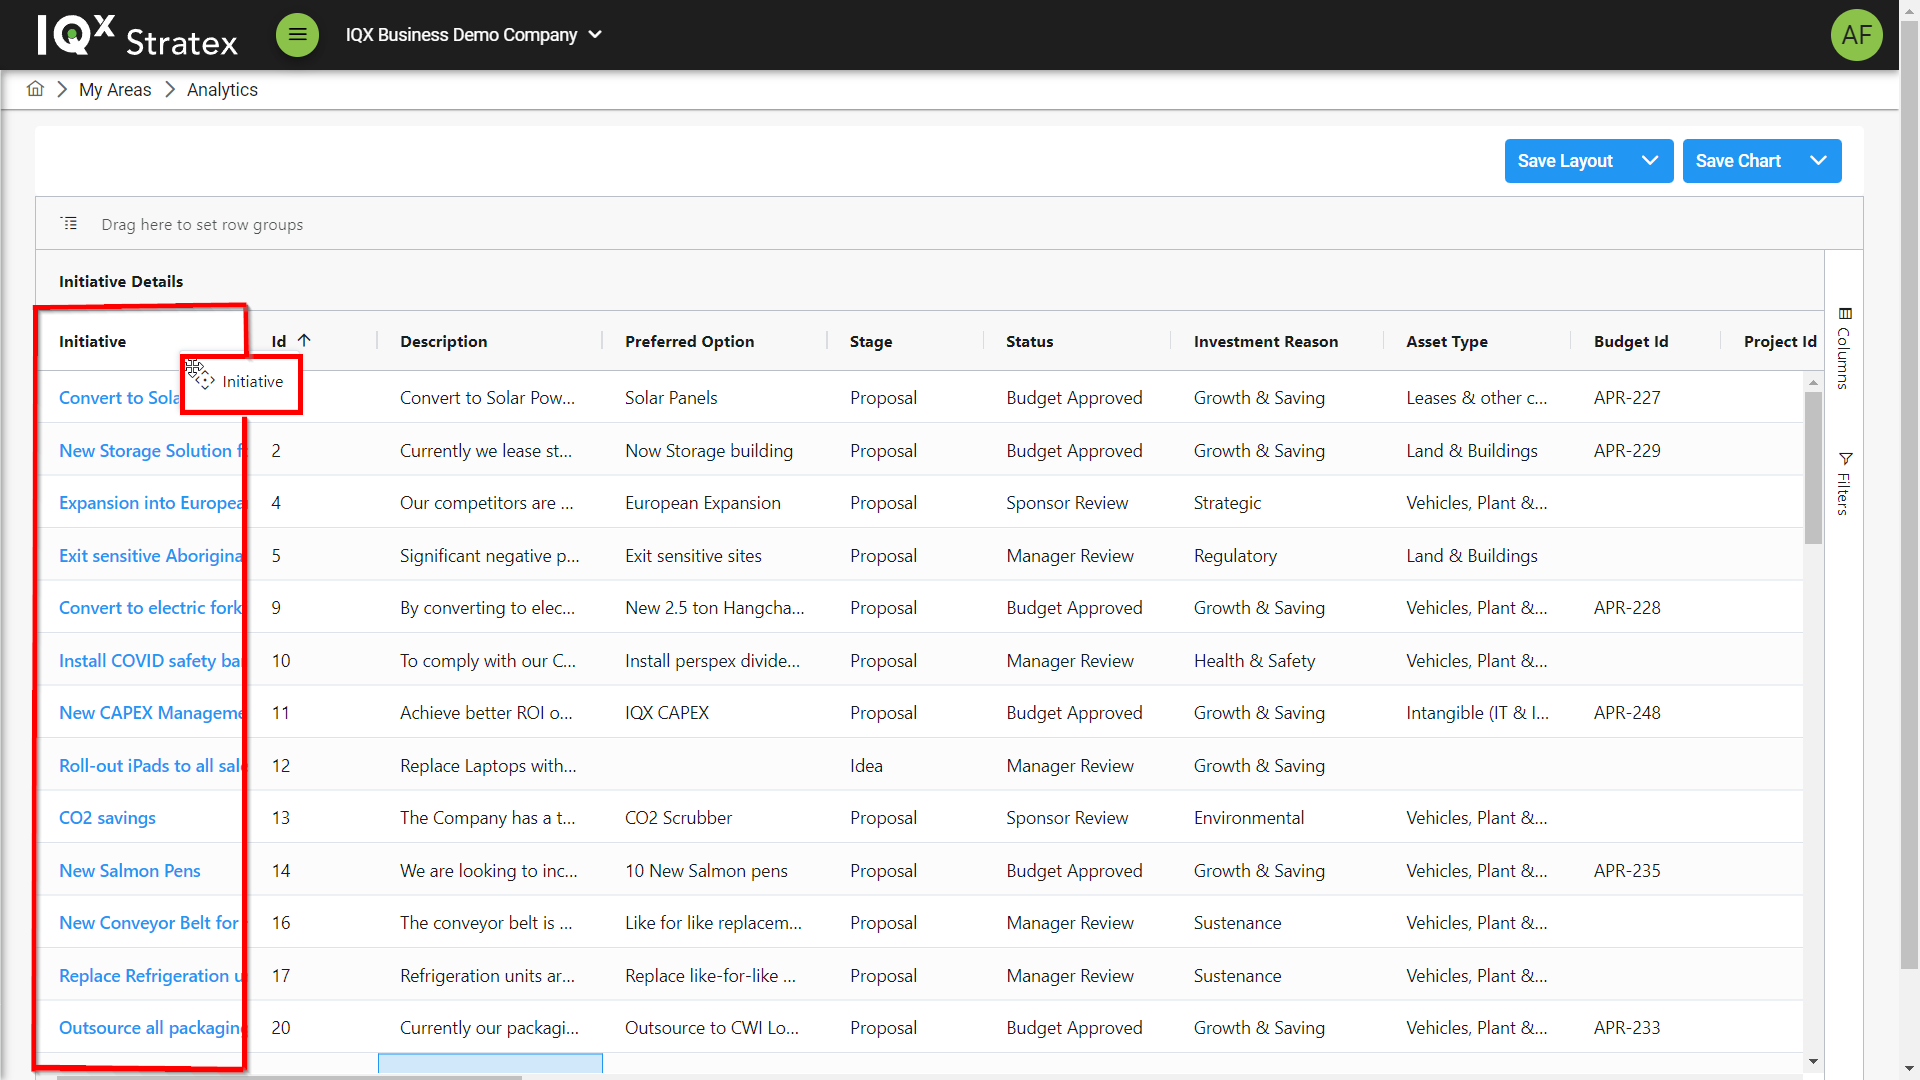
Reordering columns
Columns can be reordered based on personal preference.
To reorder a column hover over a column header until the drag and drop icon appears (3 lines) and then hold the mouse down and drag the column to a new location.
Configuring Columns
Columns can be configured using the columns control which can be brought up by clicking Columns on the right bar.
The columns control consists of the following important aspects:
Column Checkboxes - Used to show/hide columns in the table view
Column Group Control - Used to expand/collapse the column selection options by column group
Column Search - Used to quickly search for columns by typing in key words related to the column headers
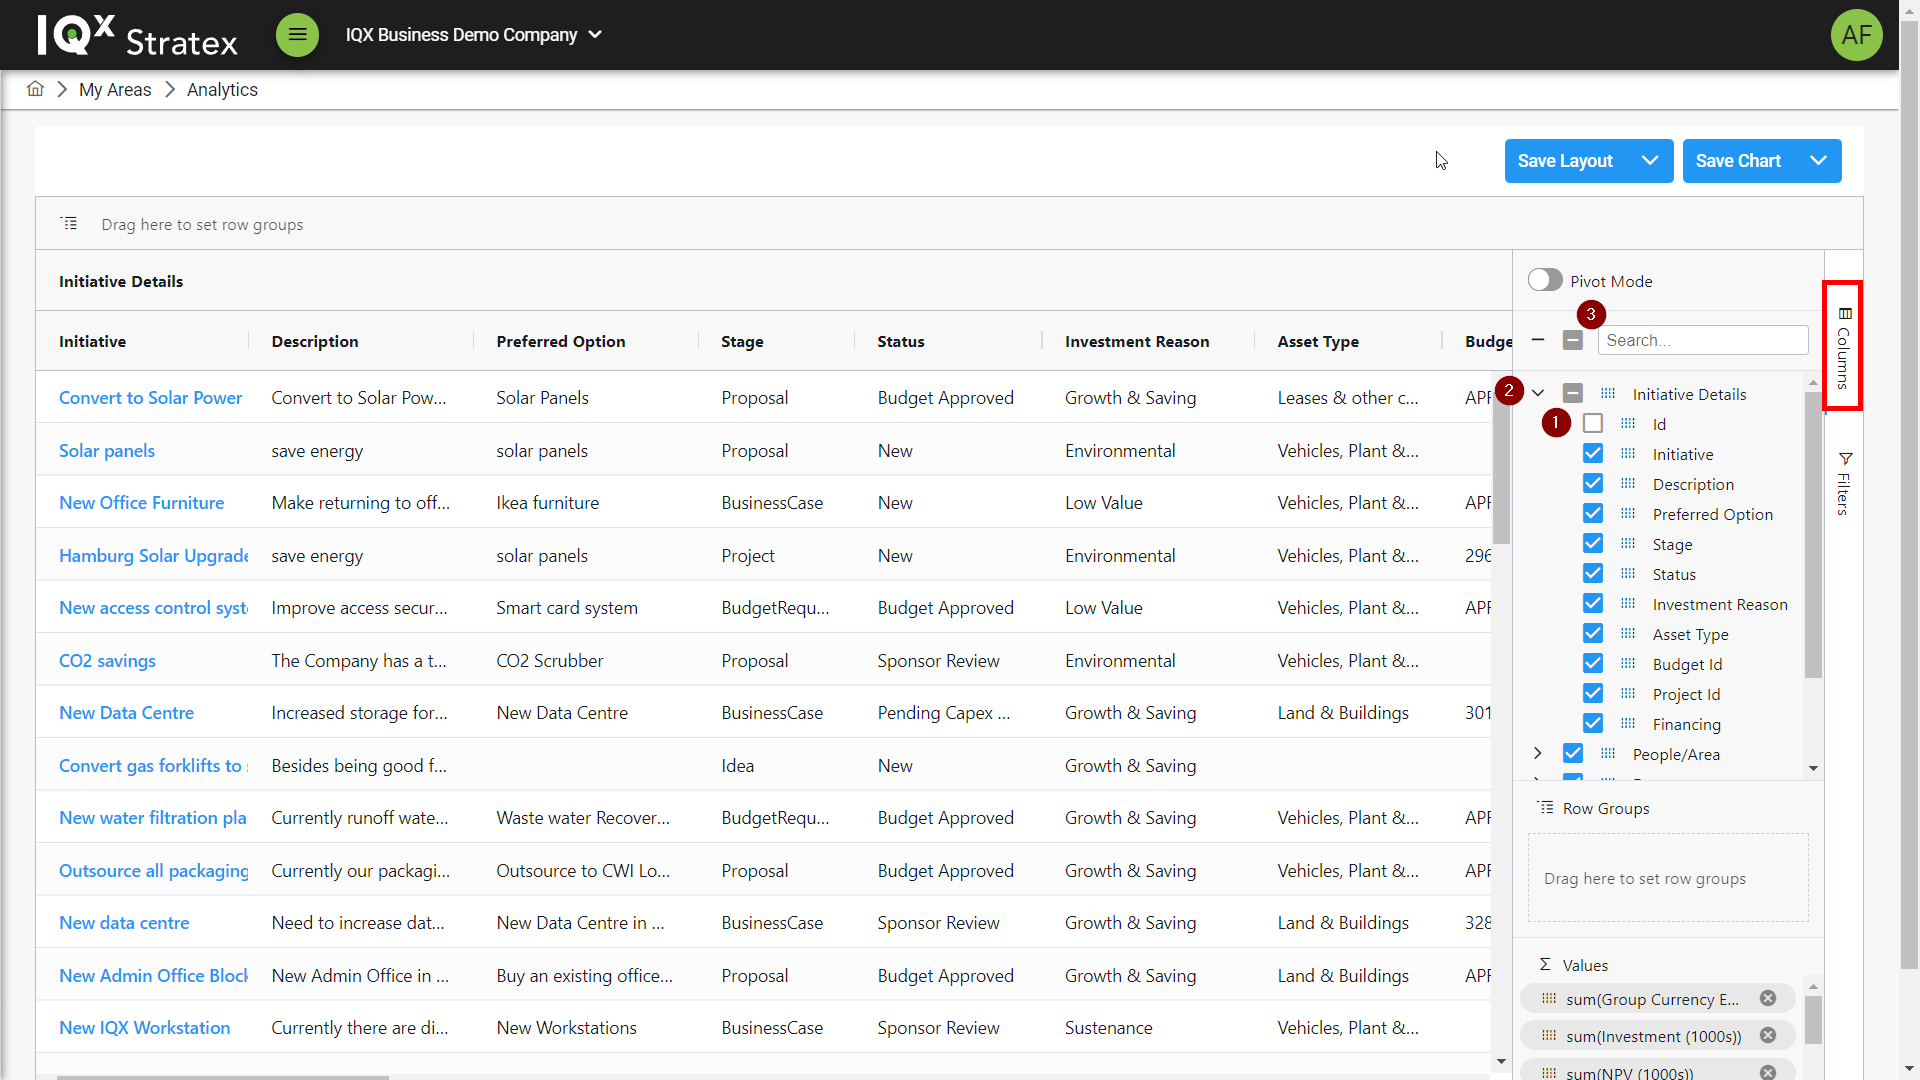
You can select a range of columns that represent information related to the initiative. These columns are categorized into the following subsections: Initiative Details, People/Area, Dates, Scores, Financial Metrics, Statistics, and Additional Information (Custom Fields created by the admin).
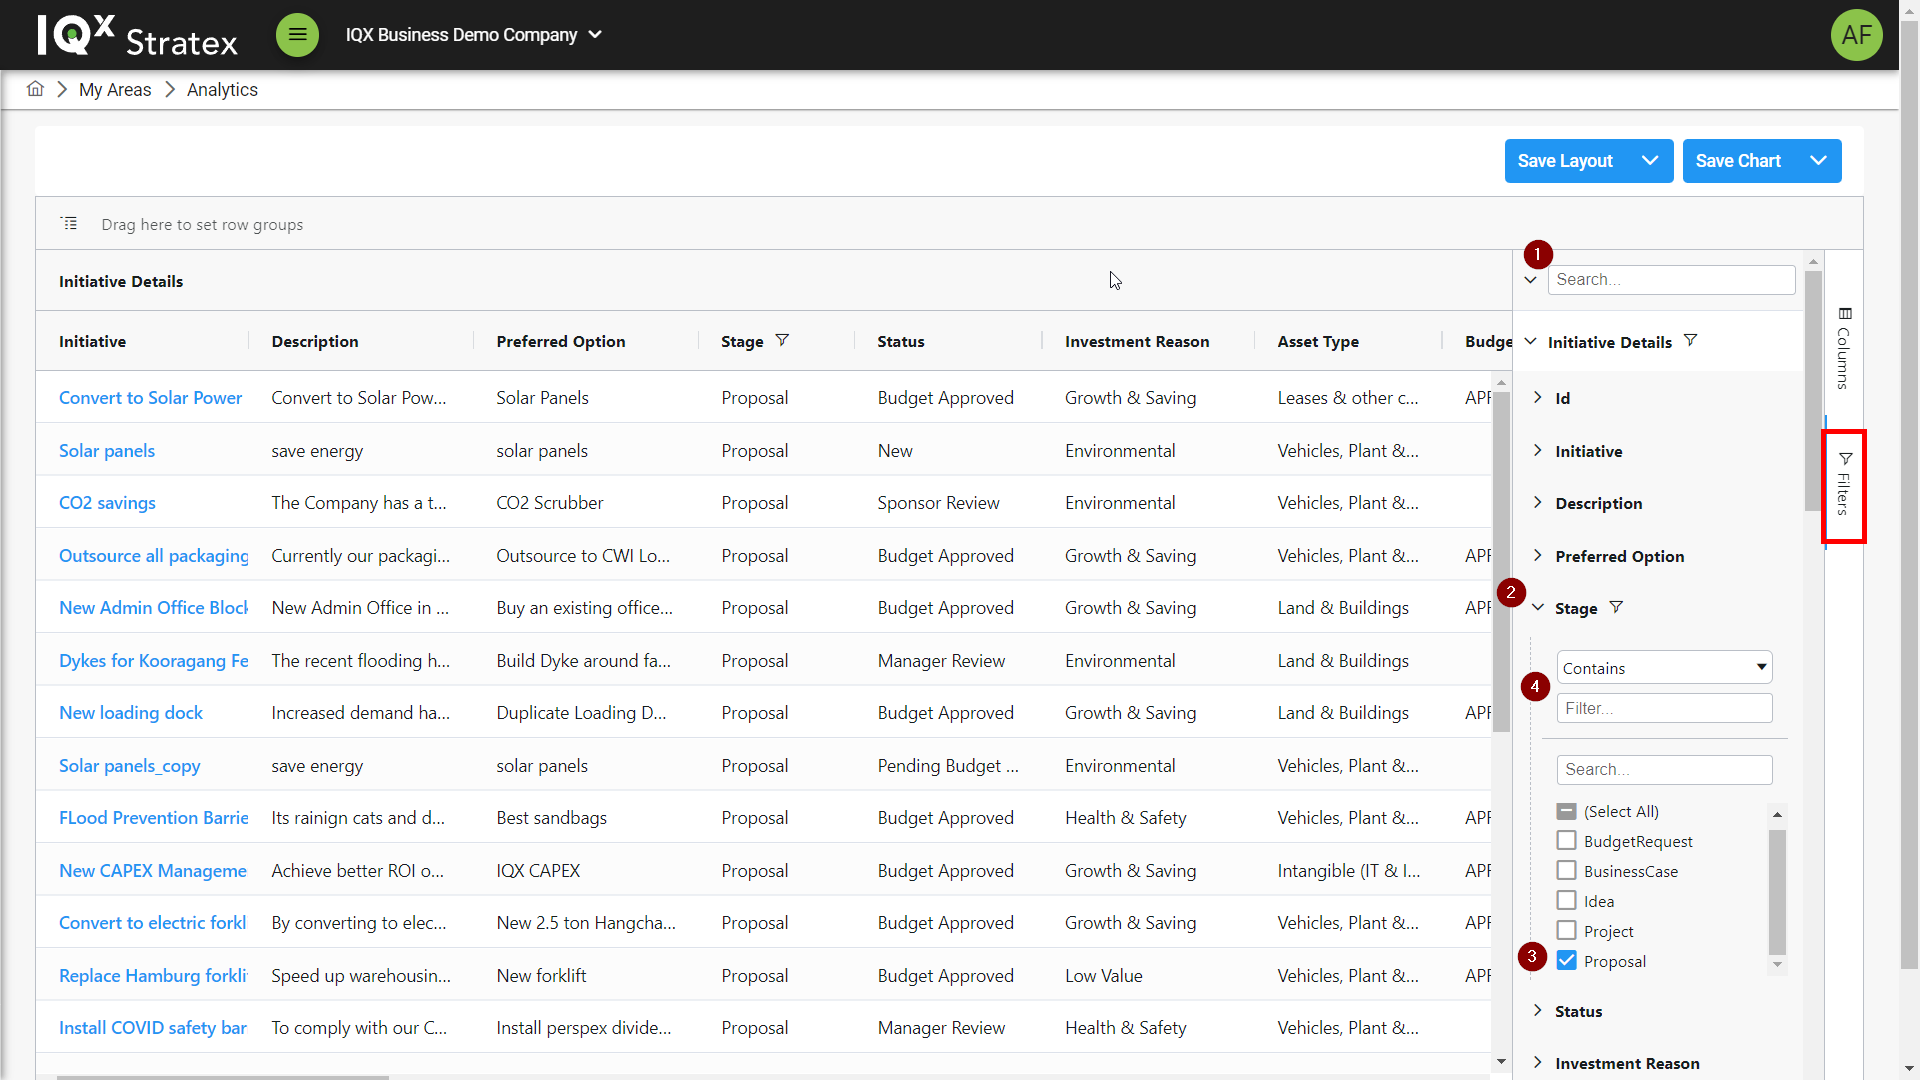
Filtering rows
Filters can be applied to easily locate relevant initiatives based on filter criteria.
Access the filters control by clicking the Filters button on the right bar.
The filters control consists of the following important aspects:
Column Search - Used to quickly search for columns by typing in key words related to the column headers
Colum Filter Control - Used to expand/collapse the filtering options by column
Column Data Checkboxes - Used to select/deselect column data to filter initiatives on
Advanced filtering - Used to filter initiatives based on a text string and related parameter
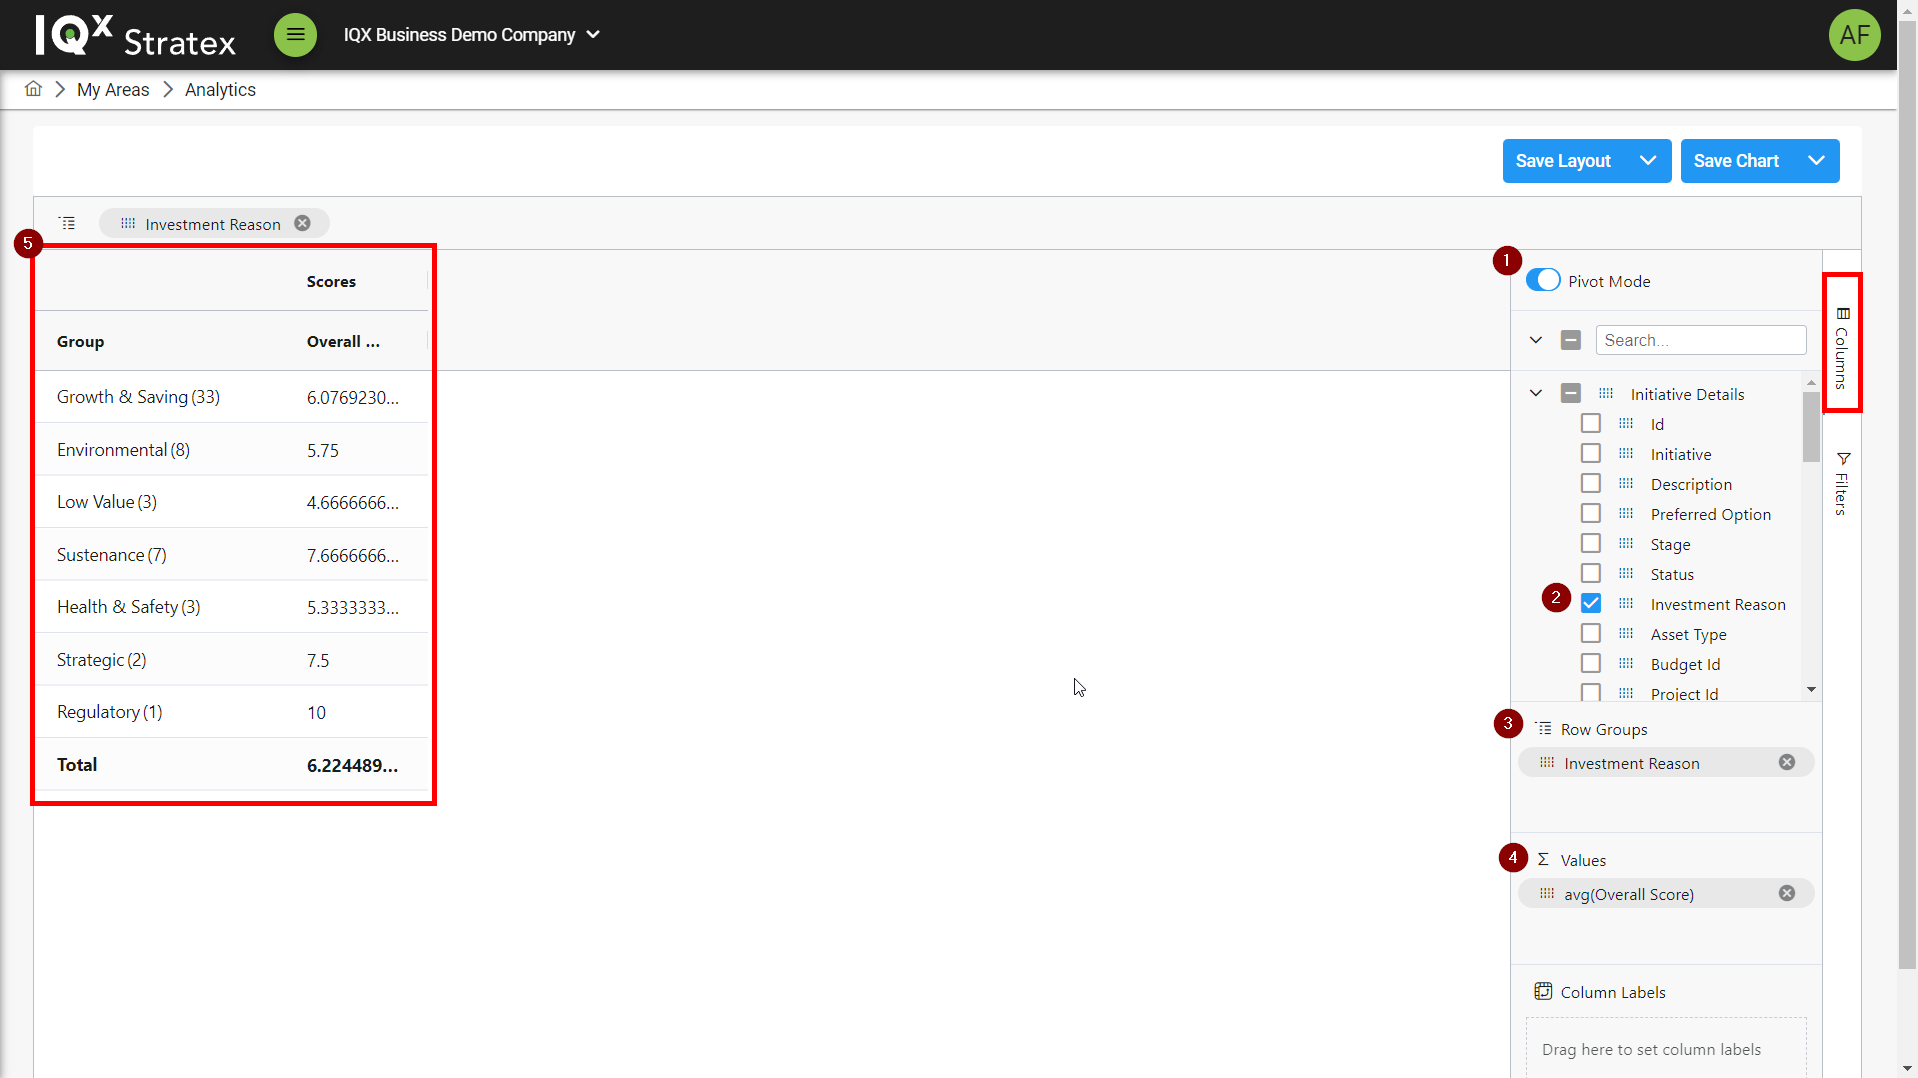
Pivot Mode
Pivot mode is a data processing tool used to query, organize and summarize data. Selecting fields for use in pivot mode facilitates rotational, pivotal, or structural changes.
Pivot mode can be enabled/disabled from within the columns control.
When Pivot mode is enabled drag a selected column into the Row Groups section of the columns control to group all initiatives by data variables related to the column.
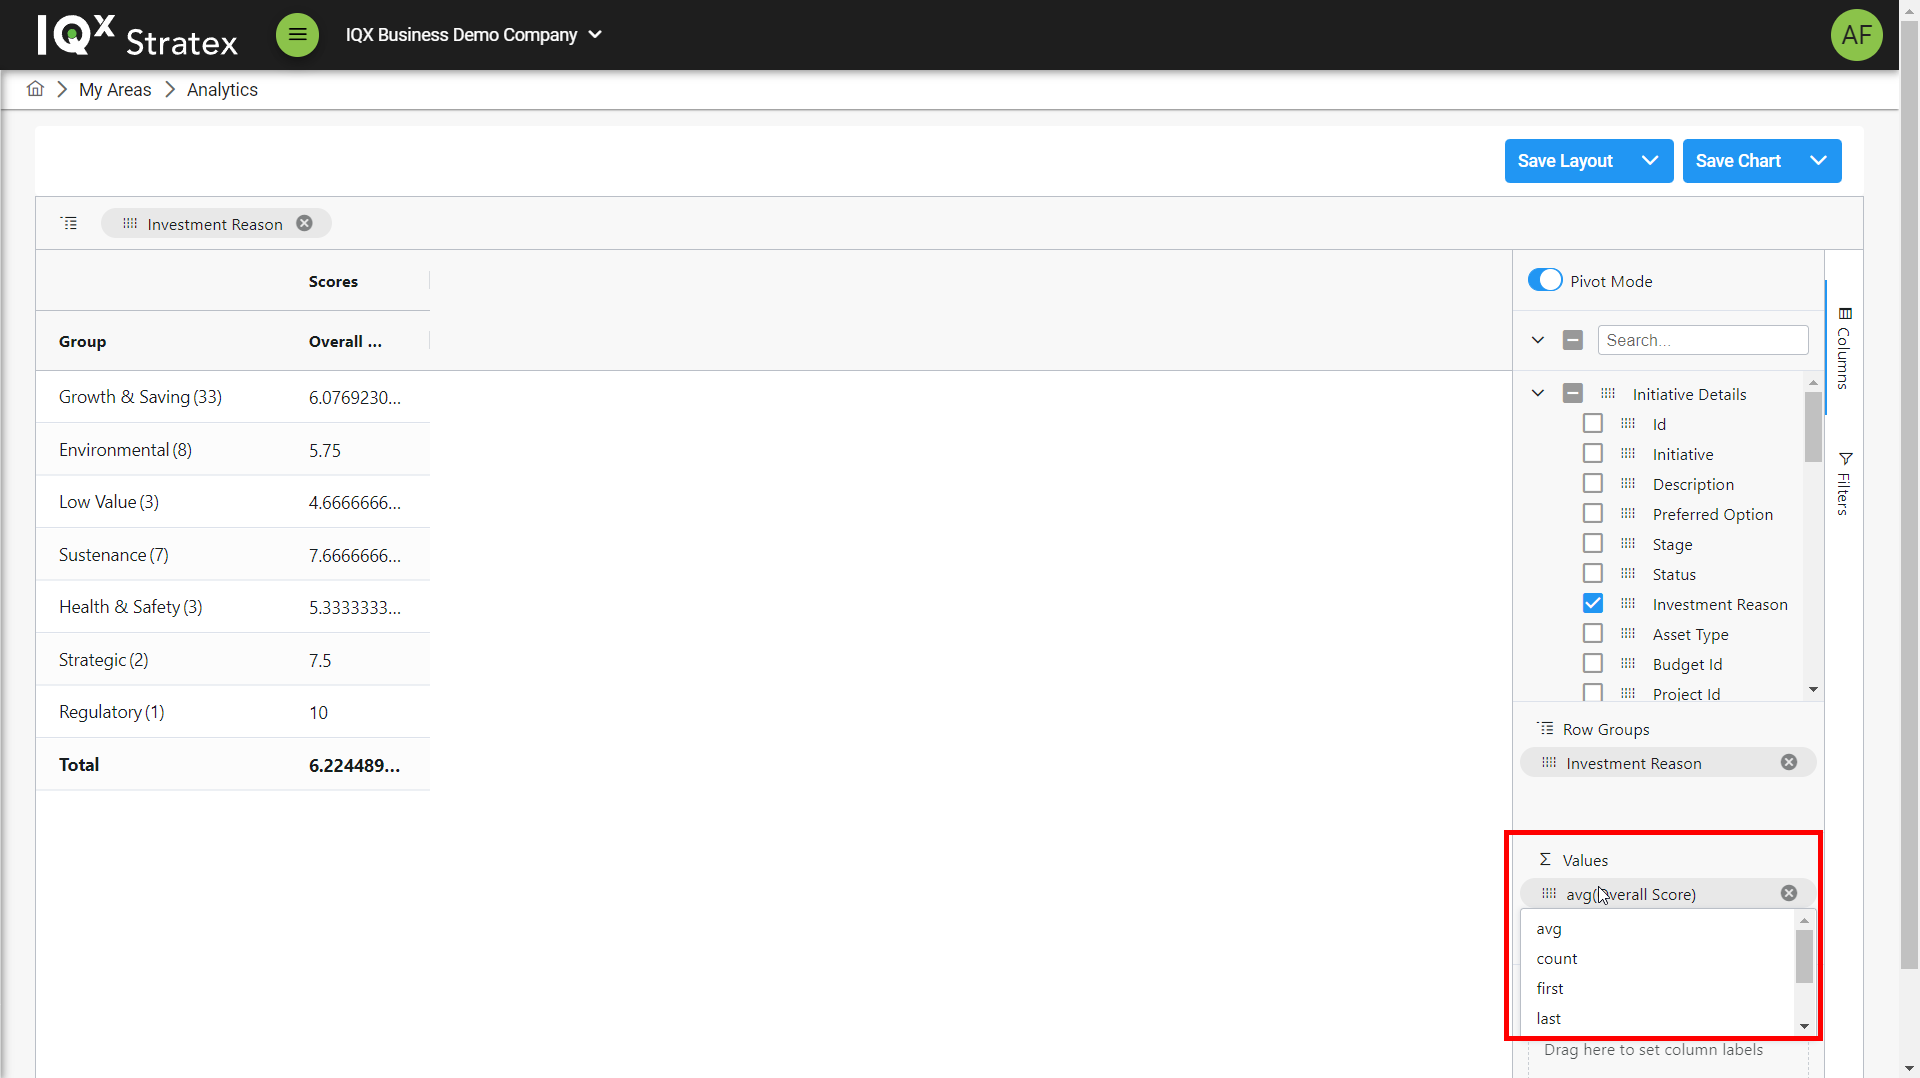
The data presented for columns can then be configured by clicking on a column under the Values section of the columns control and selecting one of the options such as; avg, sum, count.
The data table will then reflect the configuration setup.
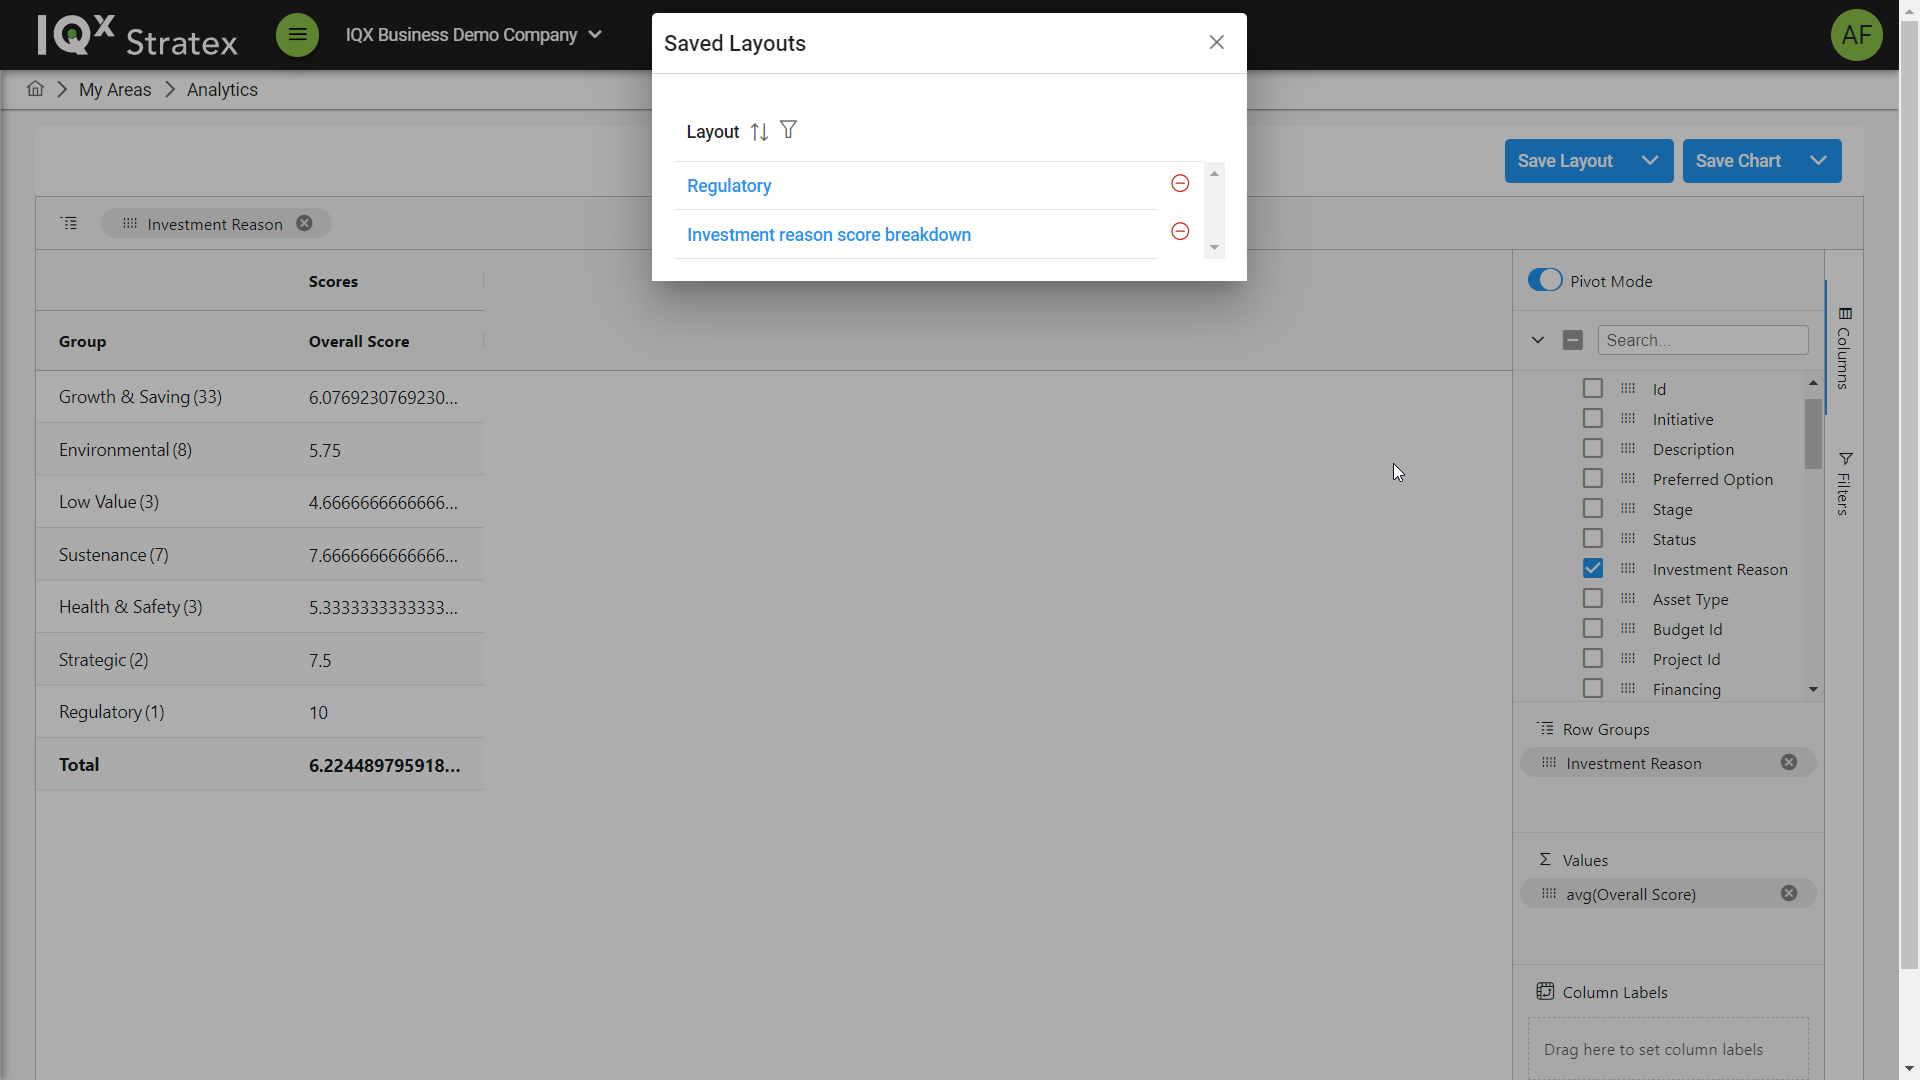
Saving and loading layouts
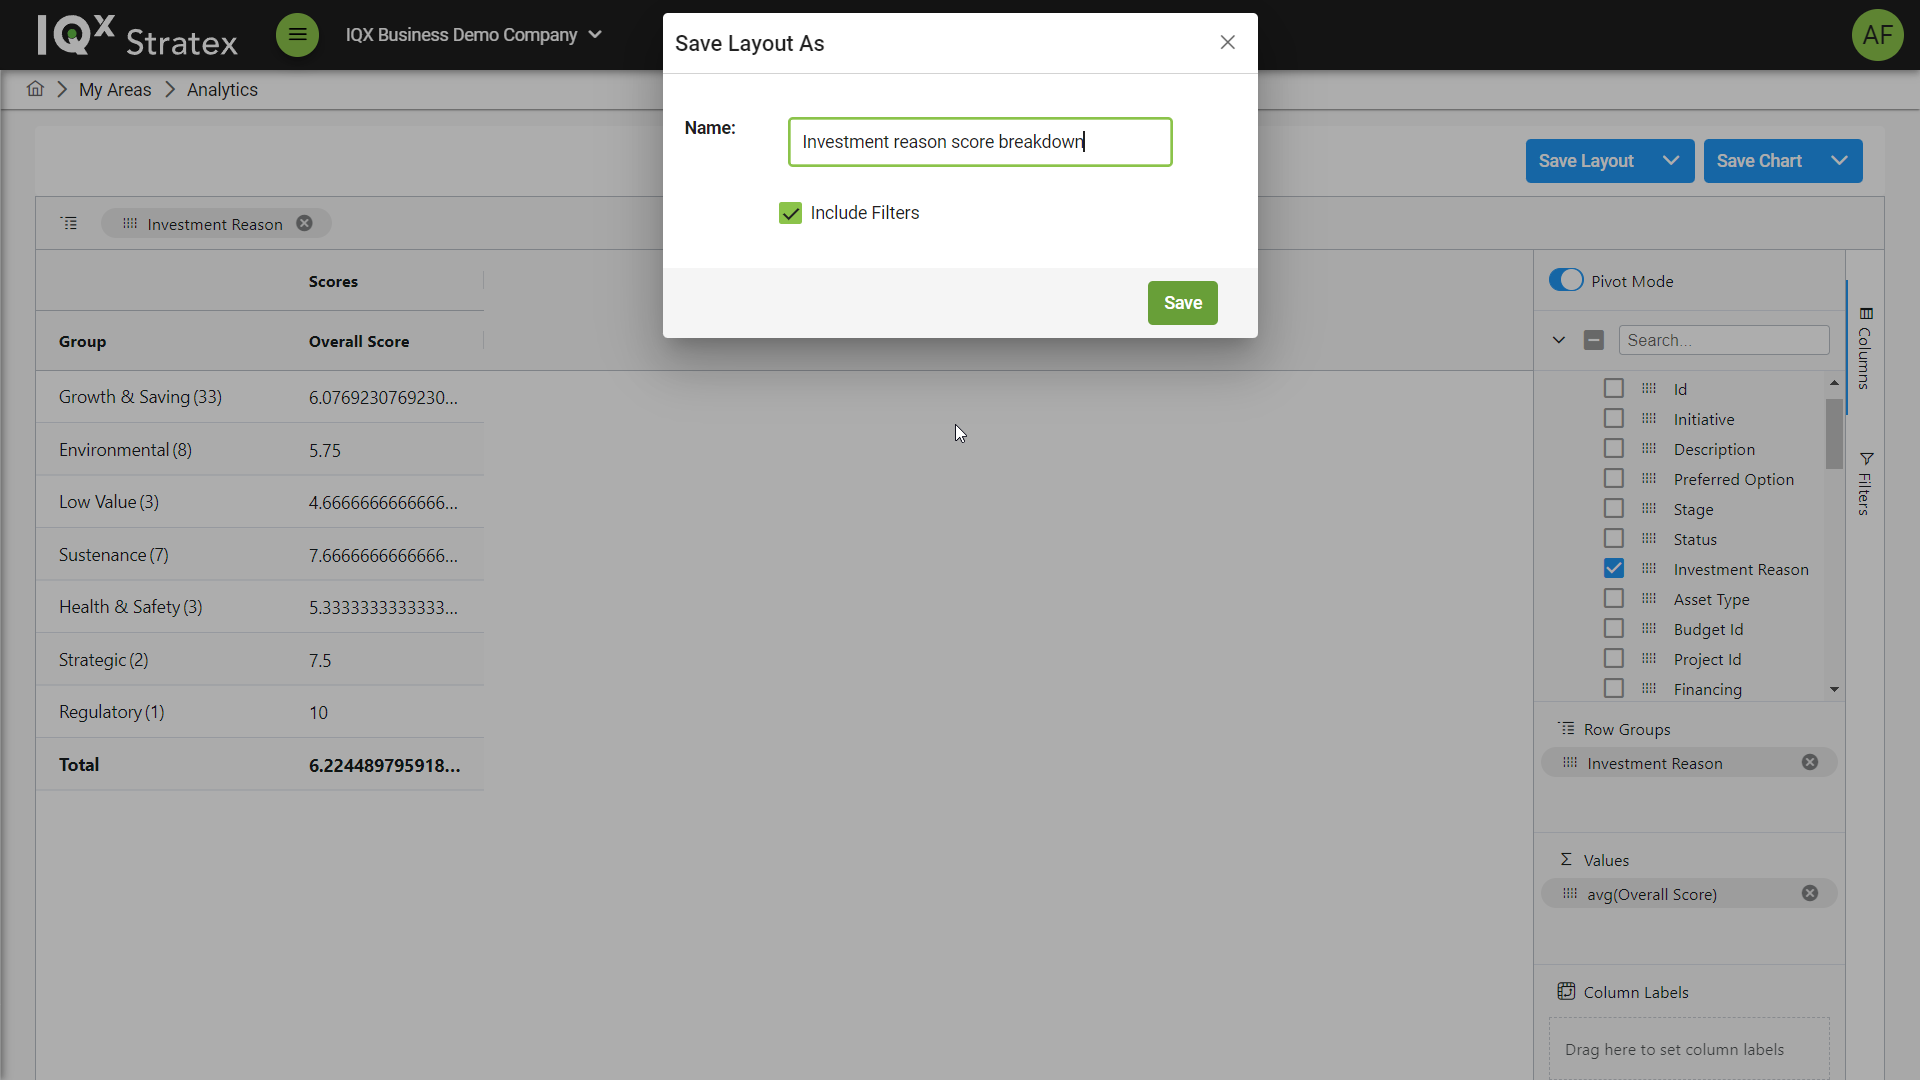
Created layouts can be saved and loaded for use in the future.
To save a layout click the Save Layout button to bring up the save chart pop-up modal and input a name and select to if current filters are required for the chart.
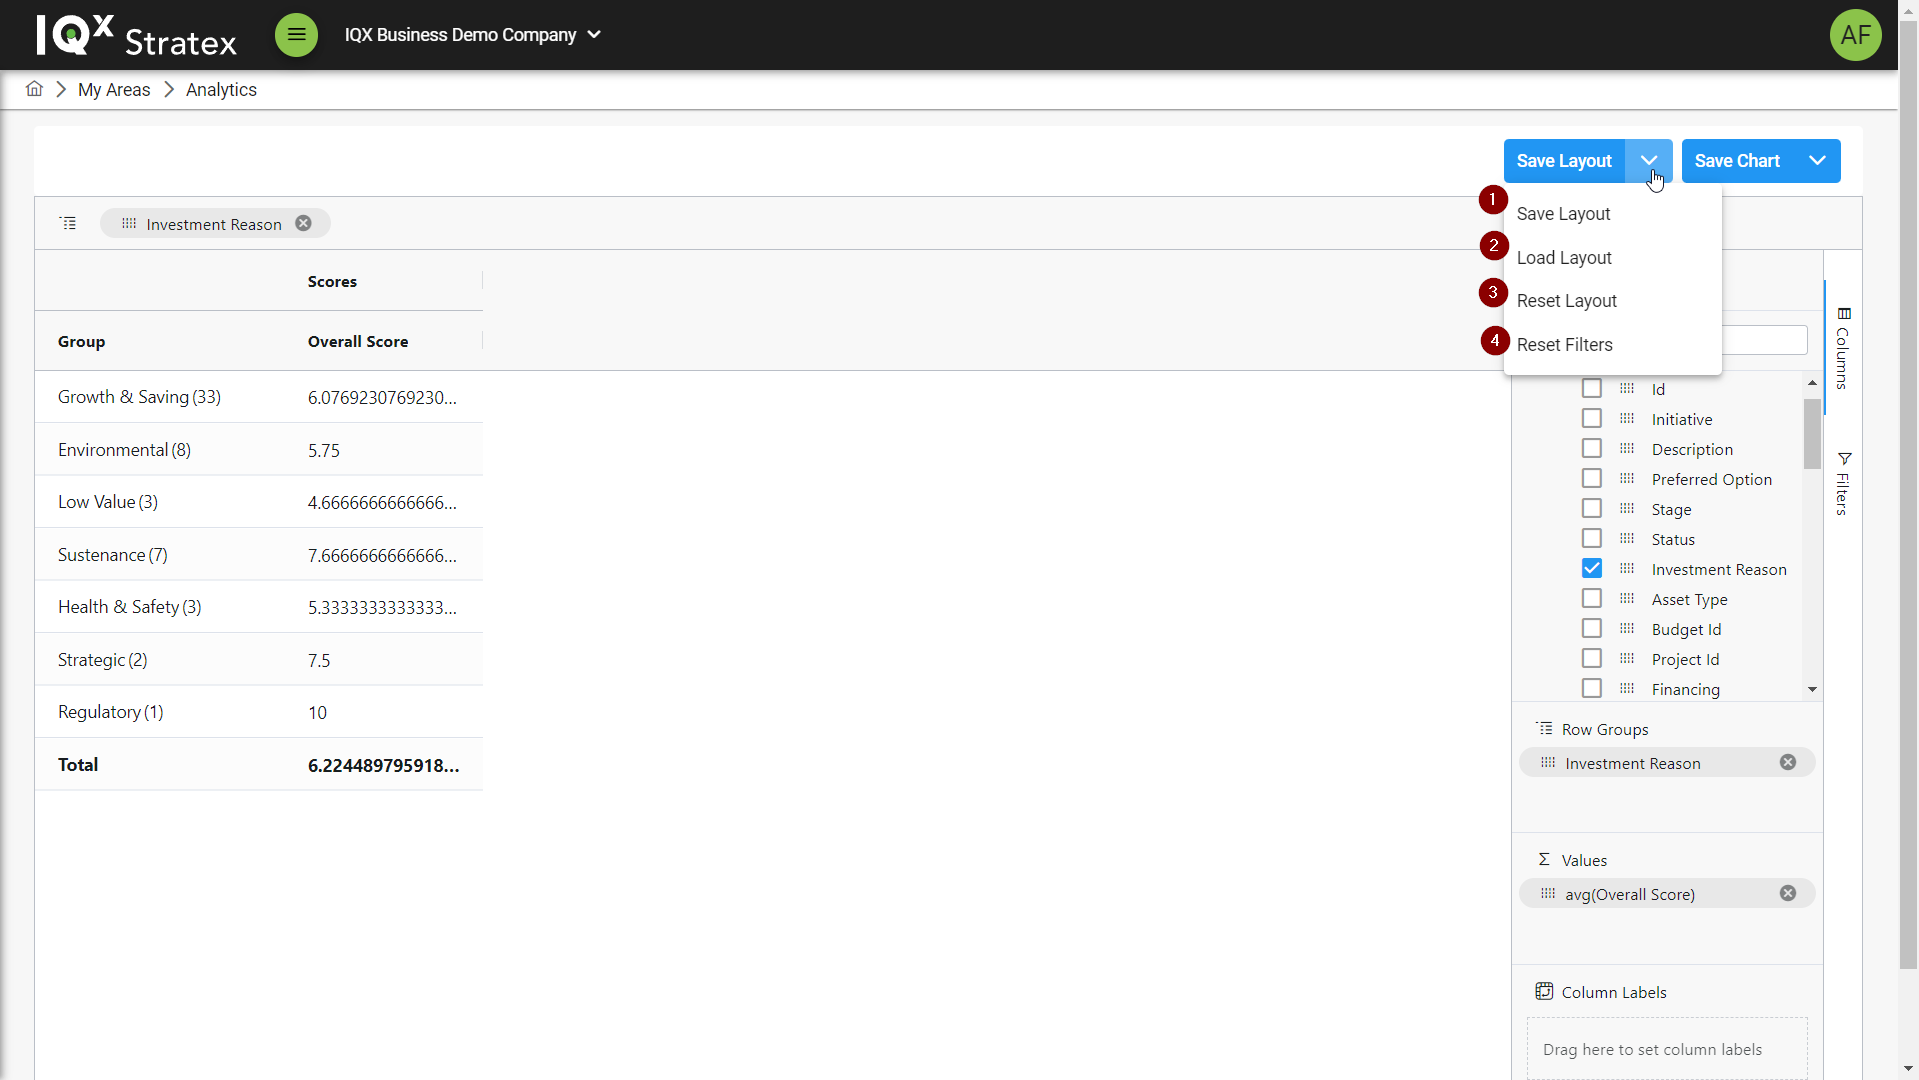
To load a layout click the Load Layout button to bring up the Saved Layout pop-up modal and select a saved Layout to load.
Charting
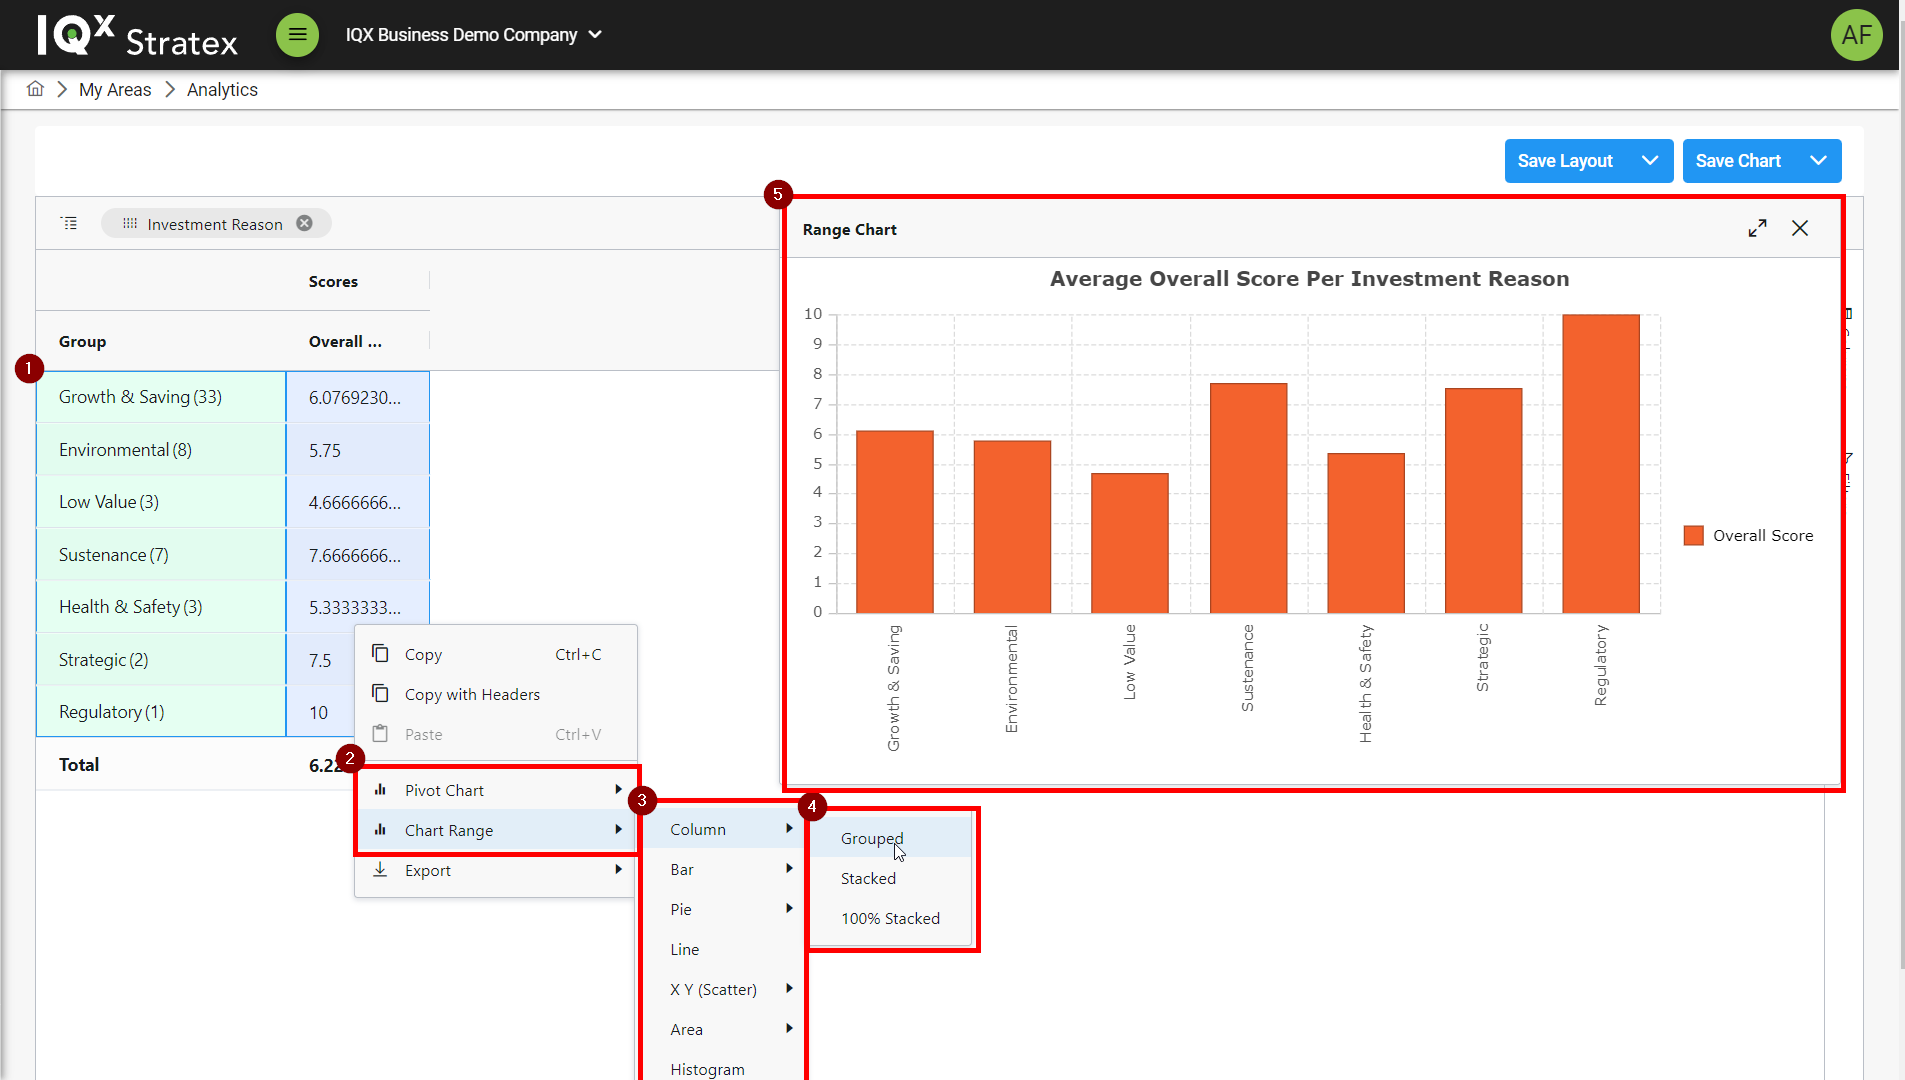
Creating a chart
Charts can be produced from data sets by doing the following steps:
Select data to create a chart from
Right click the highlighted data to bring up the actions menu and click Chart Range
Select a chart type from the options
Selected a chart type format from the options
The created chart will appear on screen
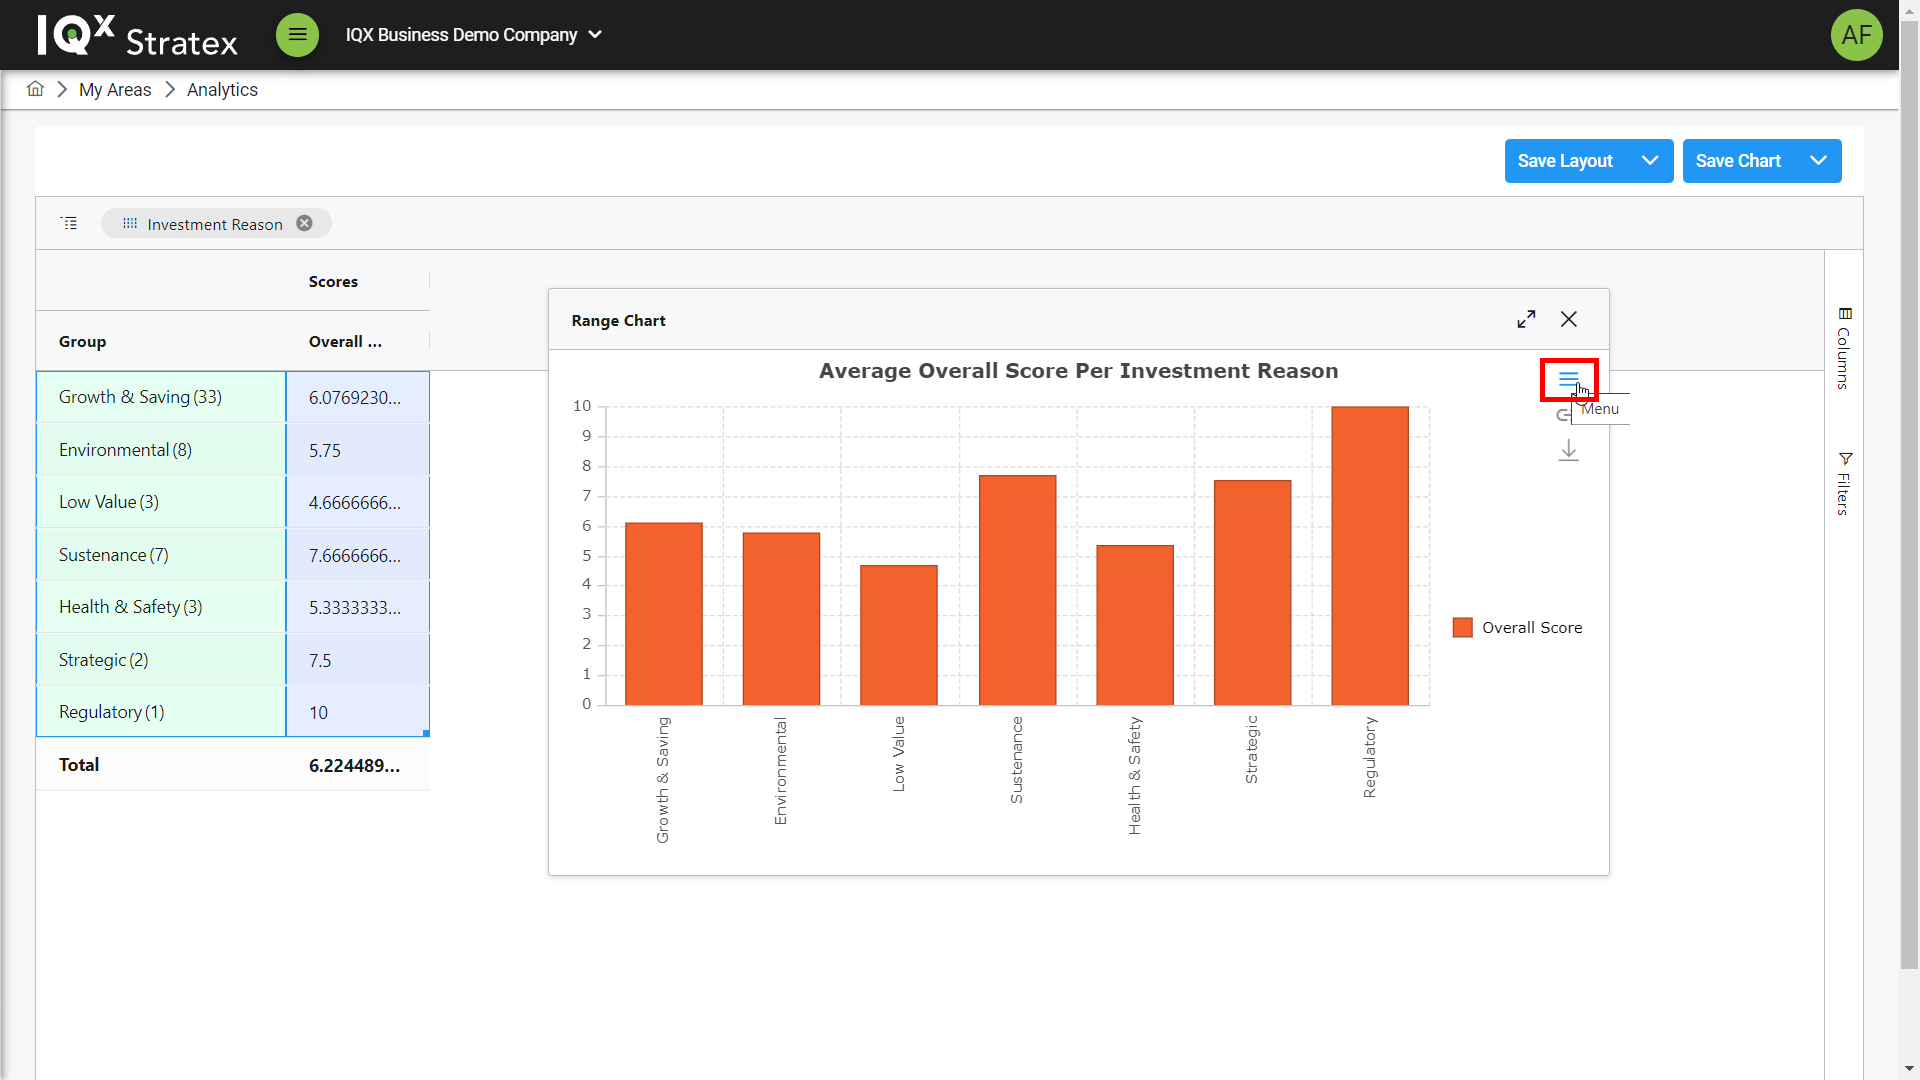
Formatting a chart
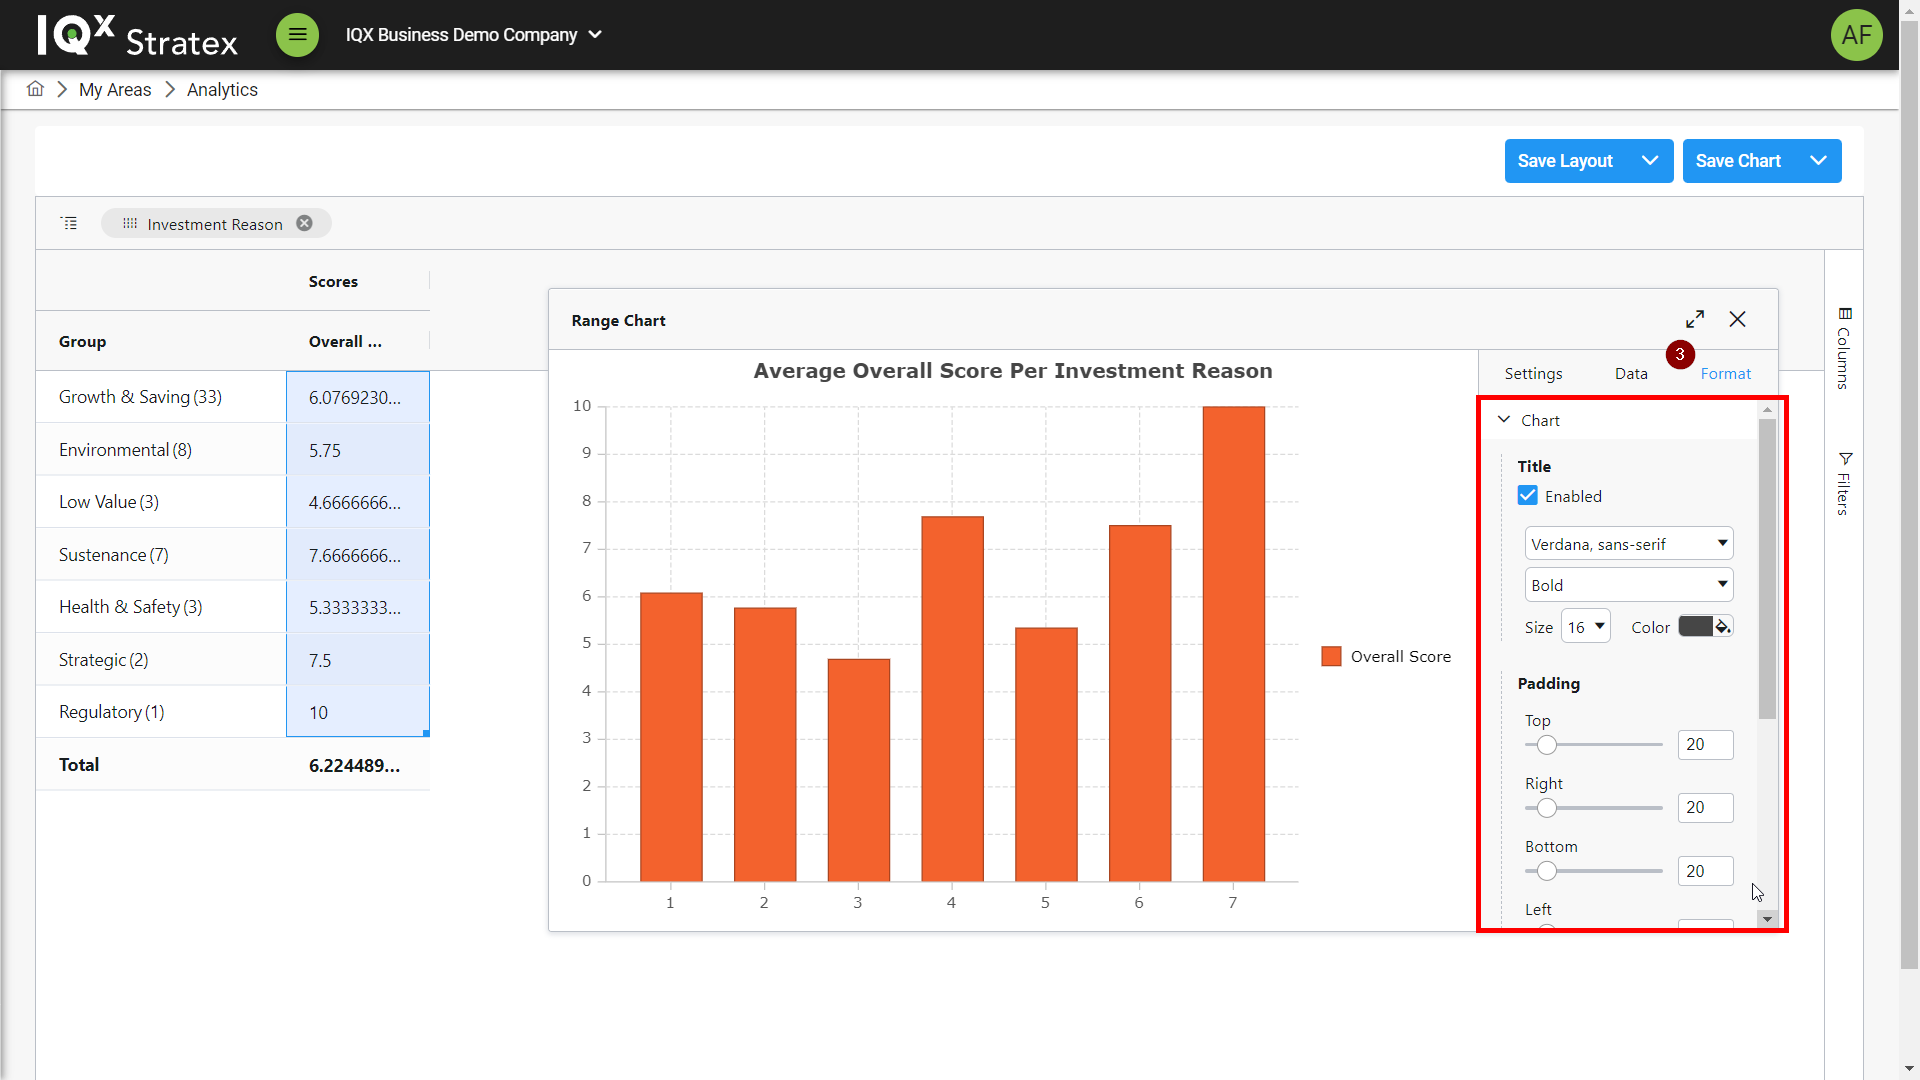
To format a chart, hover the mouse on the right side of the chart to bring up chart options and click the menu button to bring up formatting options.
The settings tab allows for selection of a chart type and colour scheme.
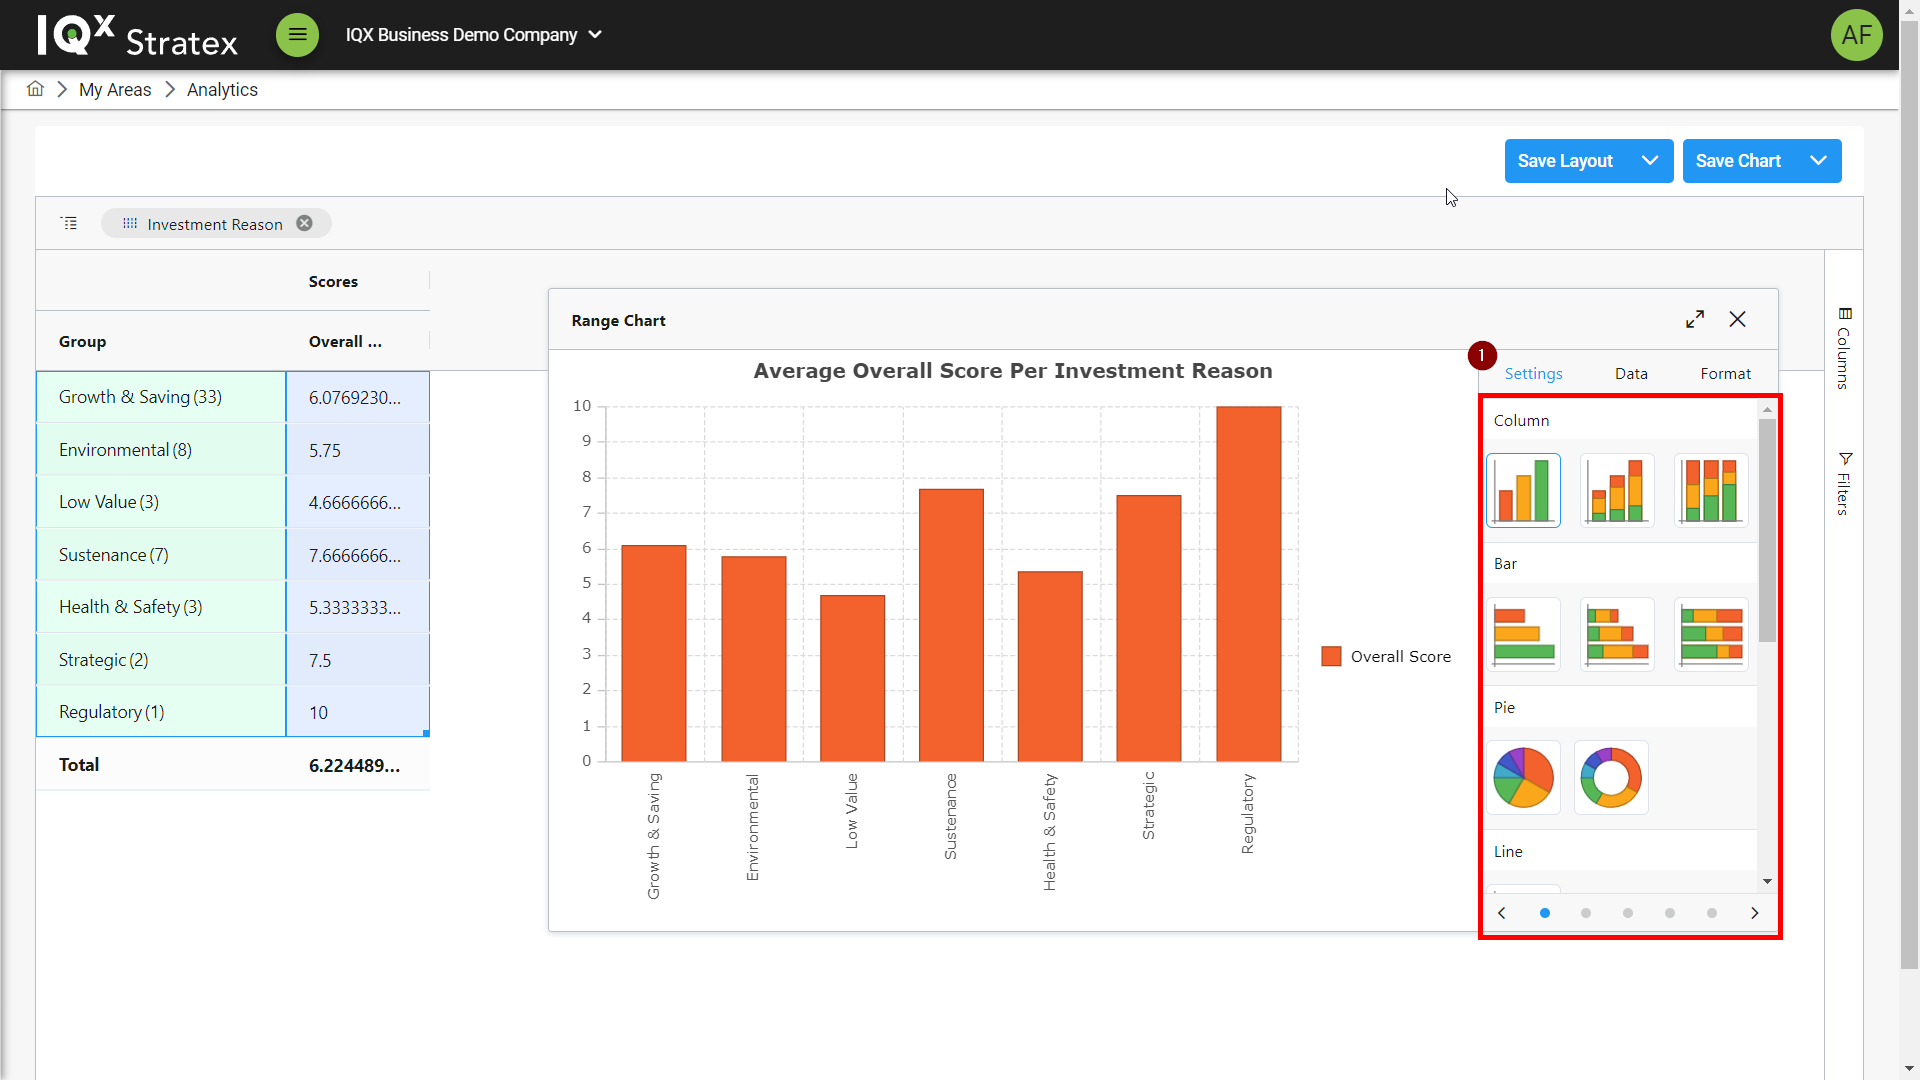
The data tab allows customisation of category labels.
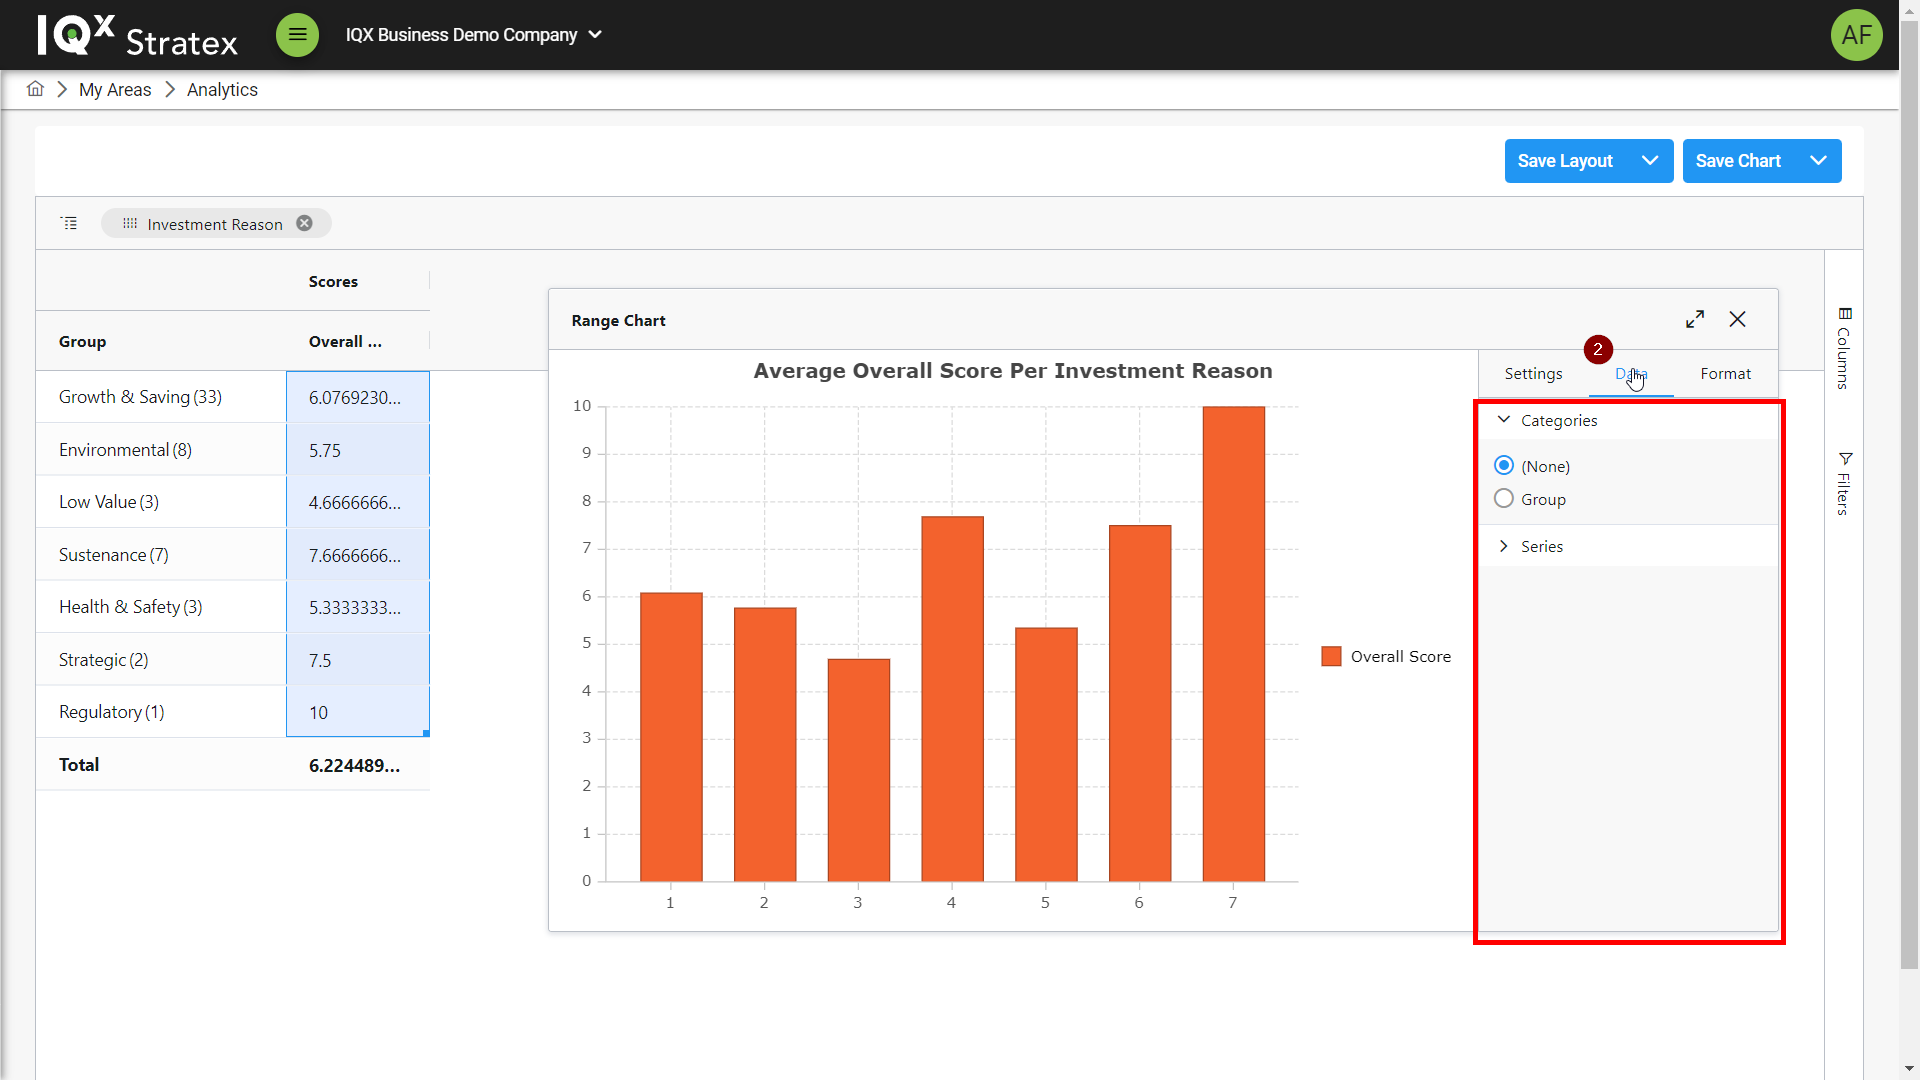
The format tab allows customisation of the chart title and axis such as font and padding.
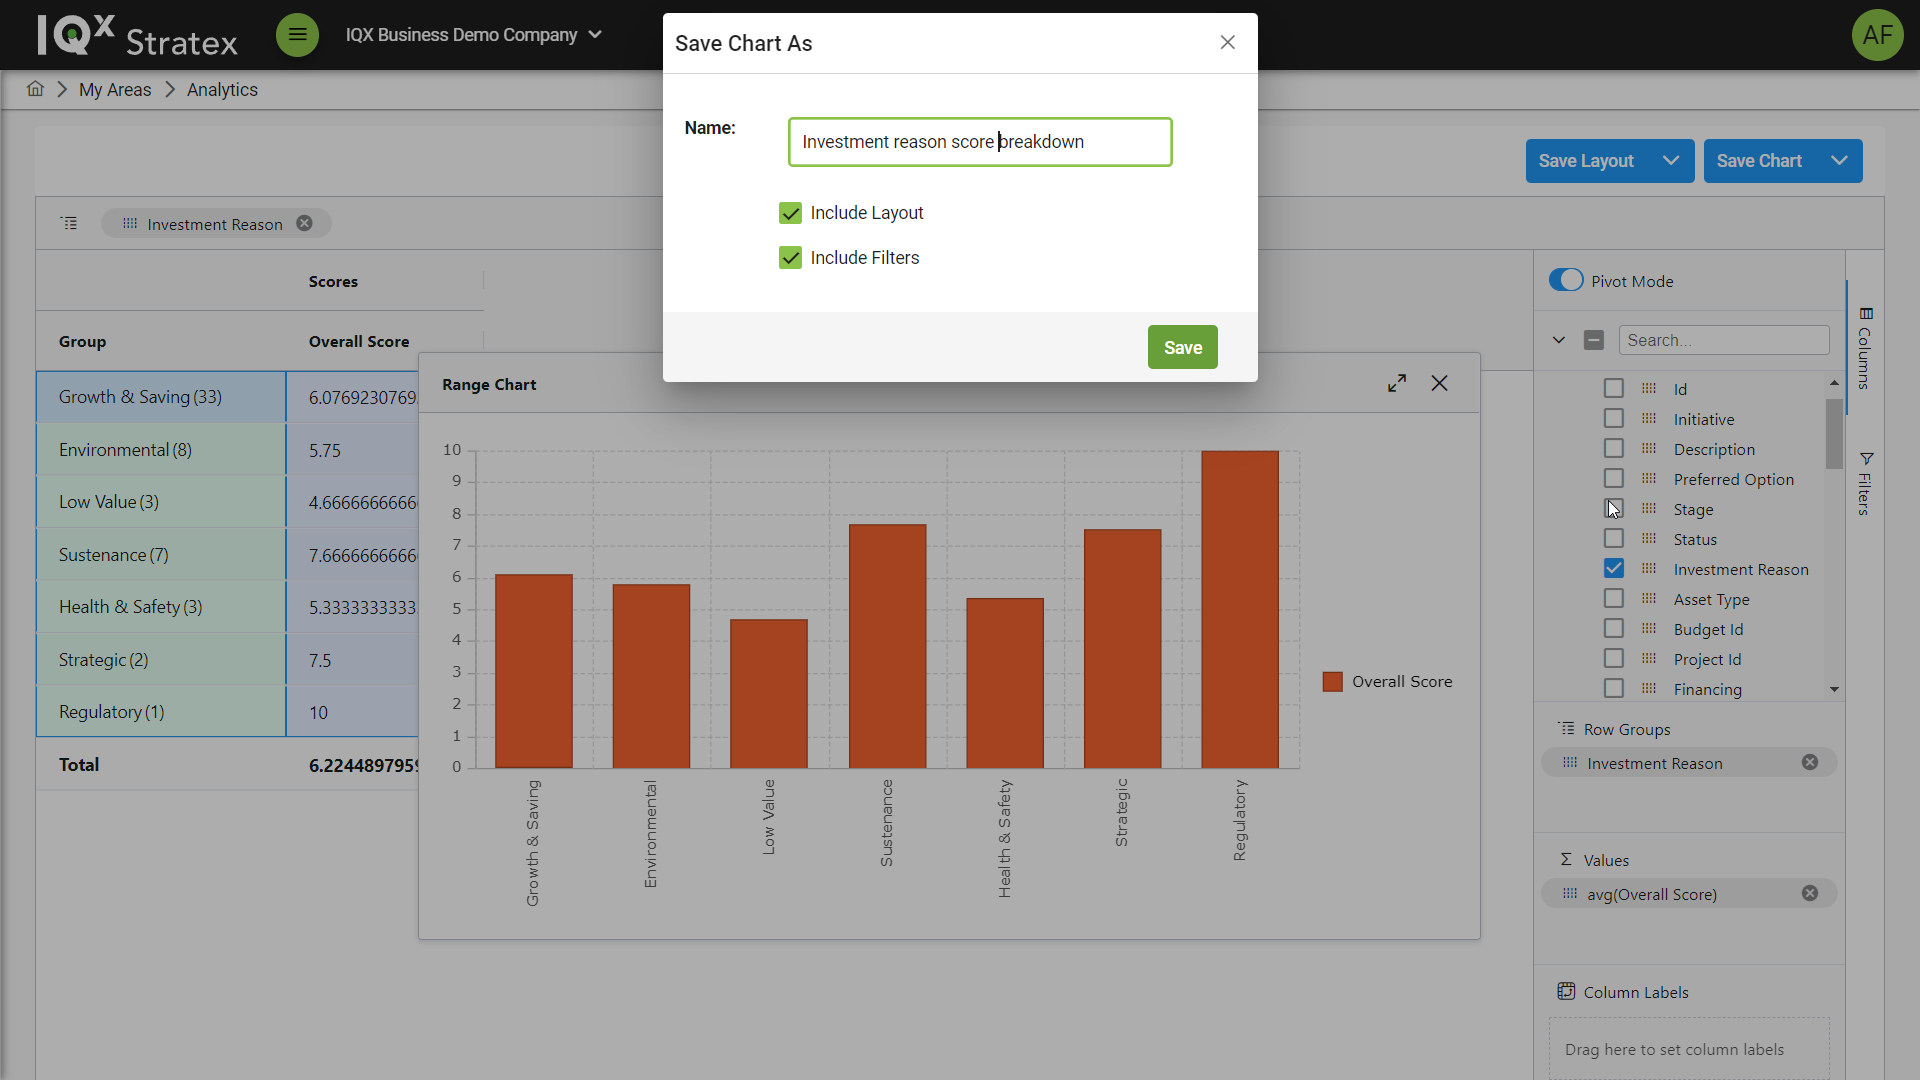
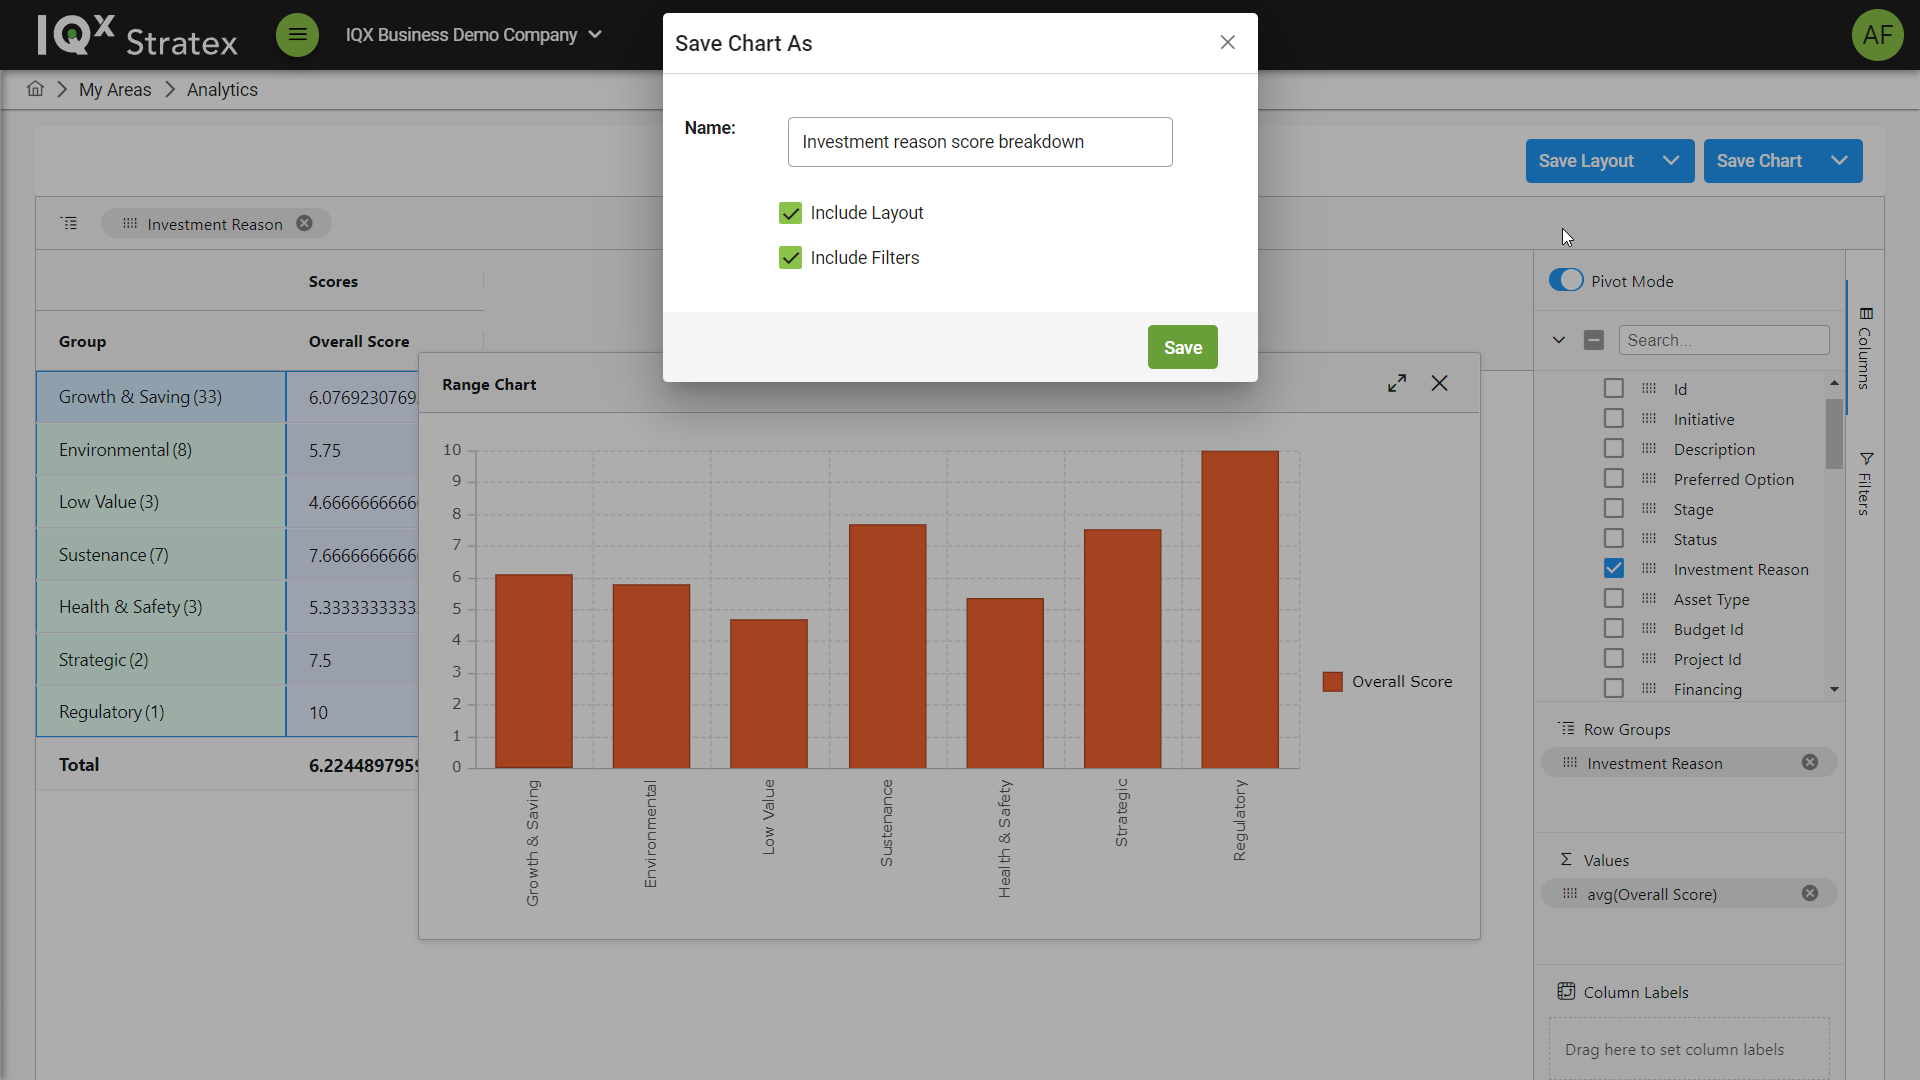
Saving and Loading Charts
Created charts can be saved and loaded for use in the future.
To save a chart click Save Chart button to bring up the save chart pop-up modal and input a name and select to if current layout and filters are required for the chart.
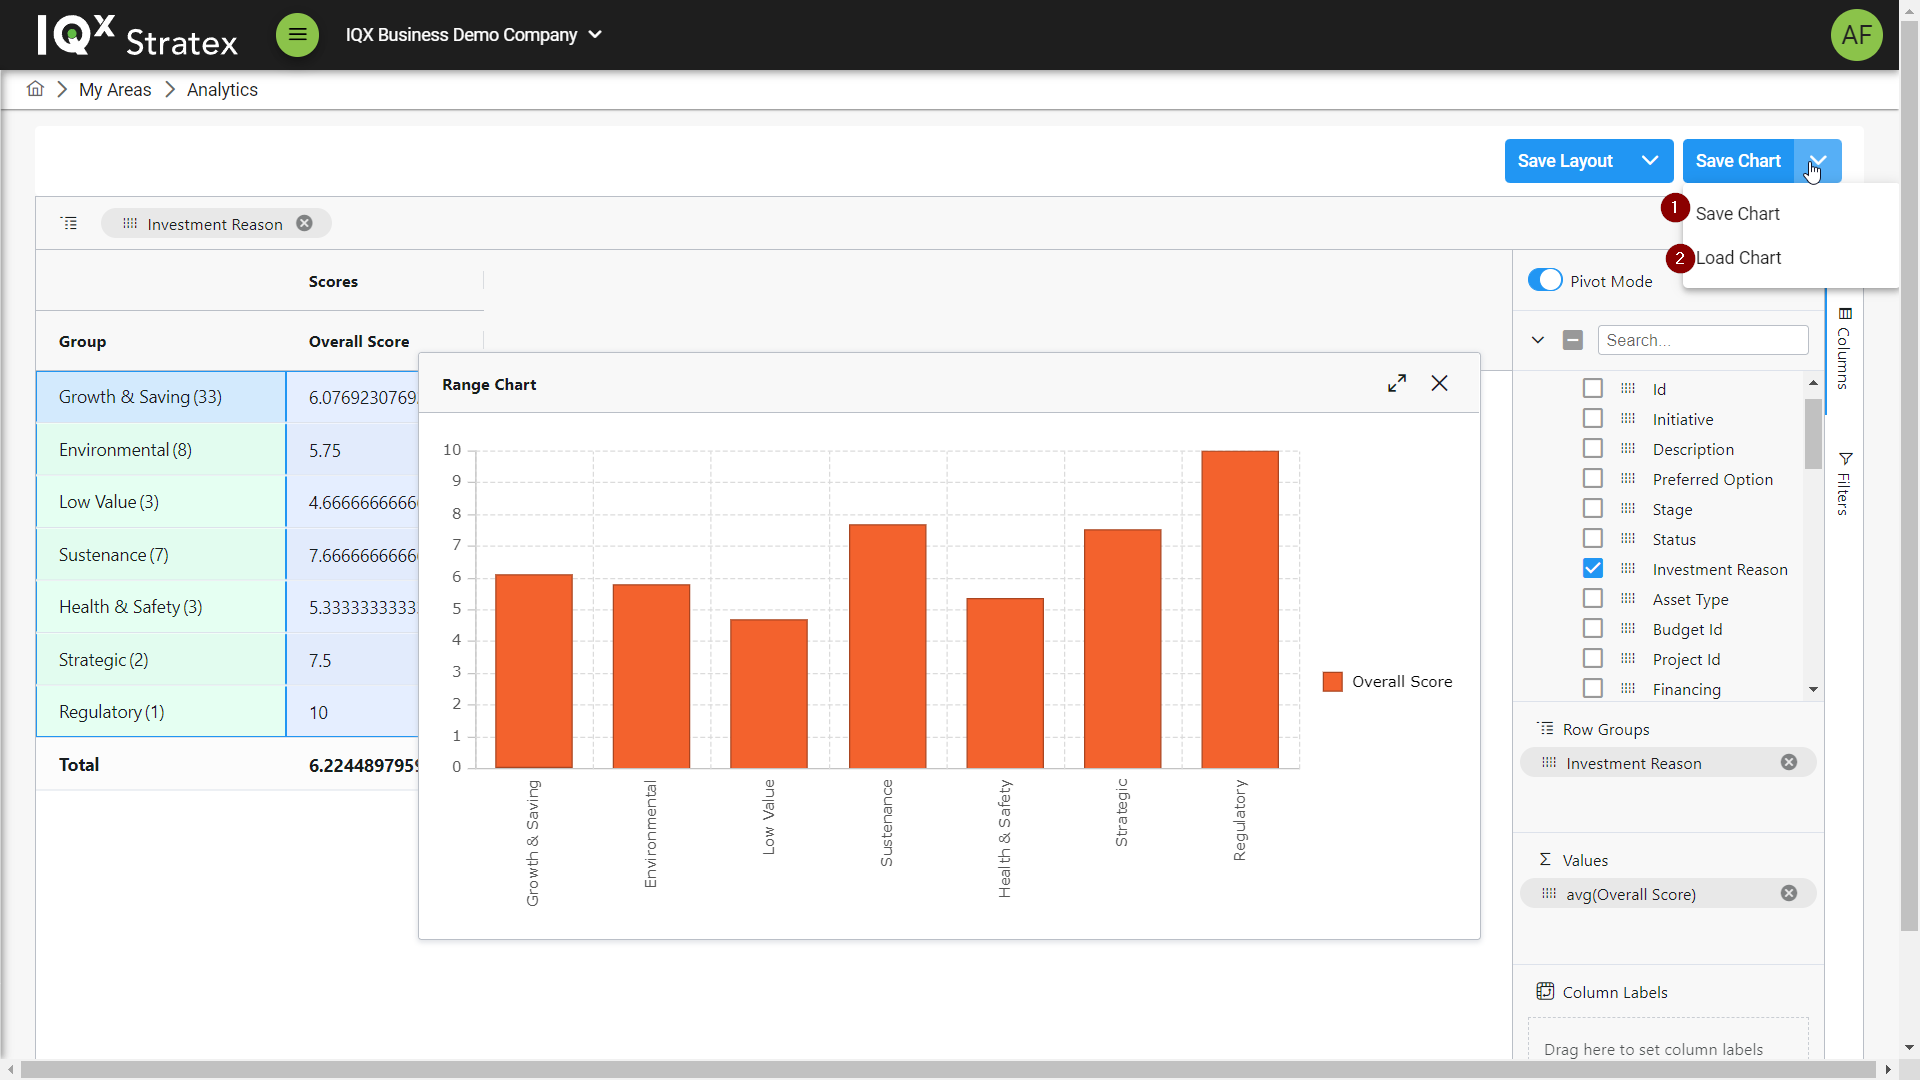
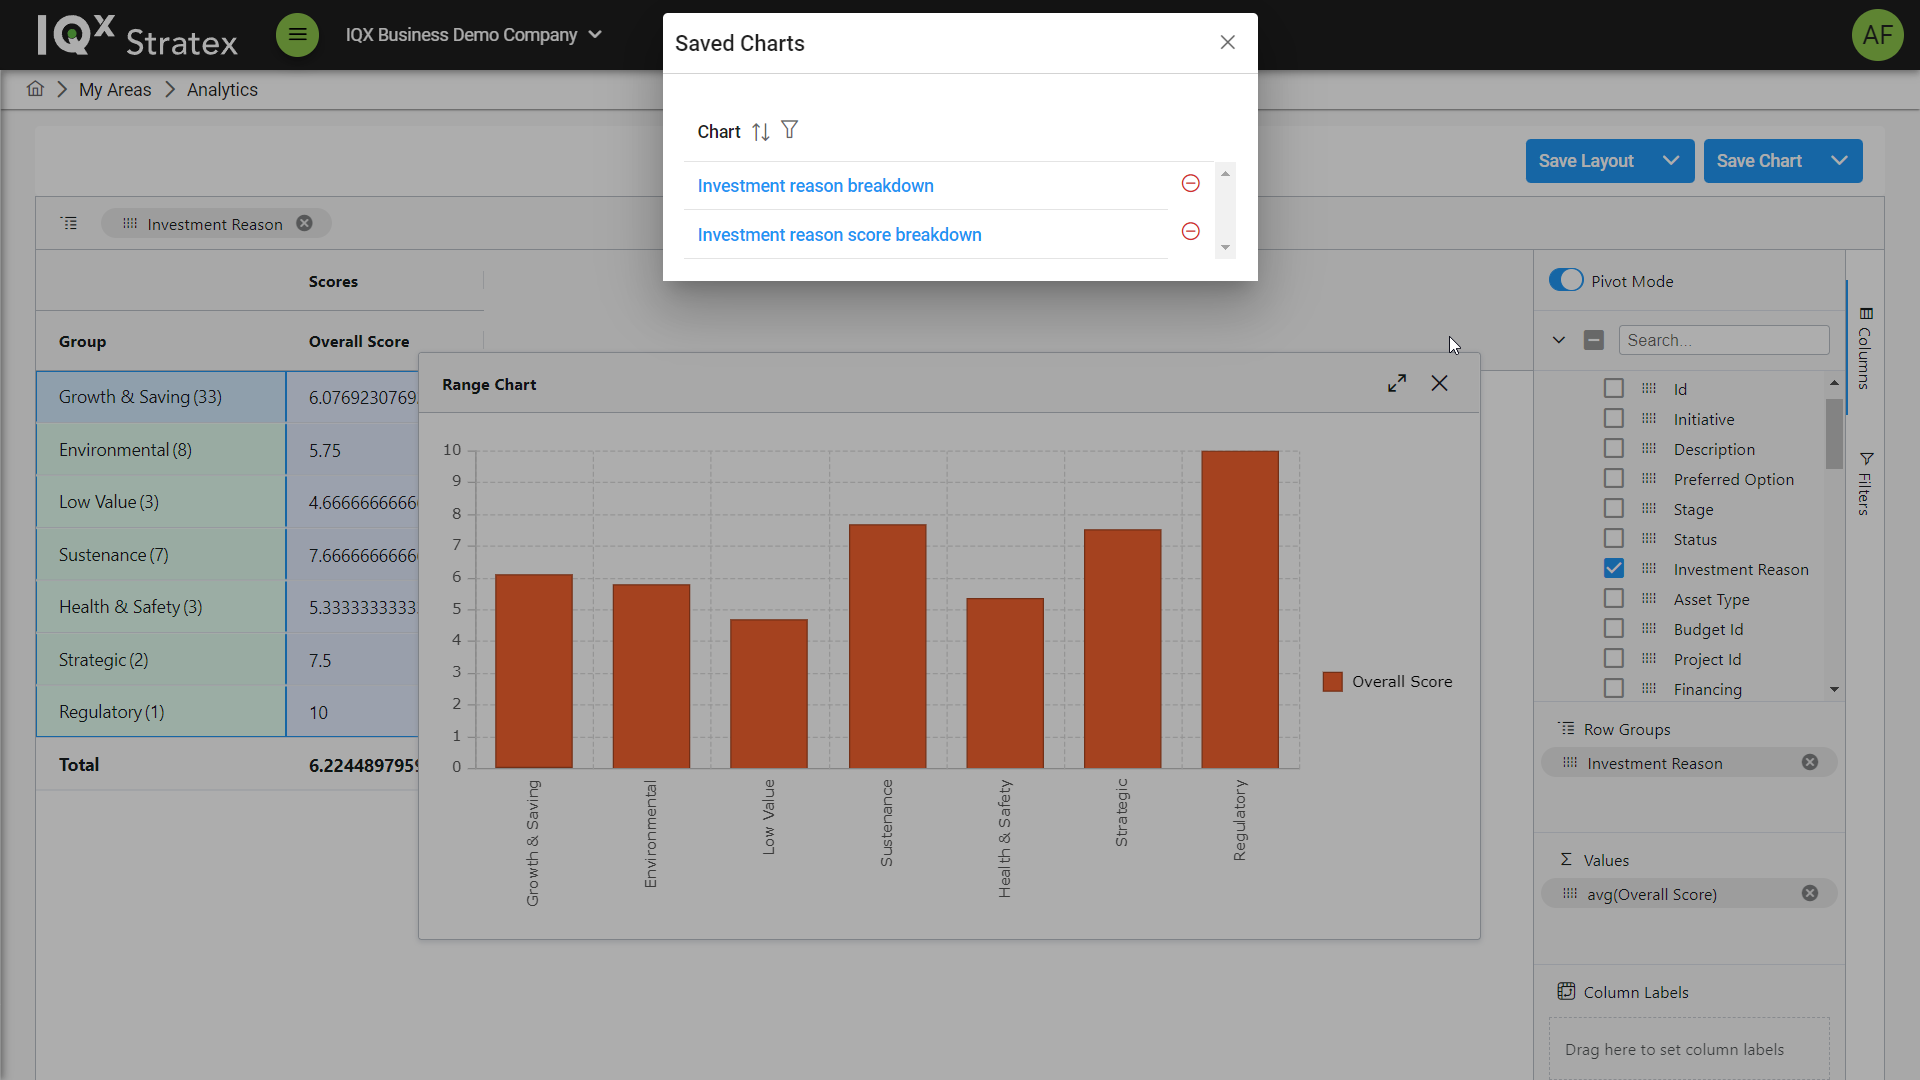
To load a chart click Load Chart button to bring up the saved charts pop-up modal and select a saved chart to load.
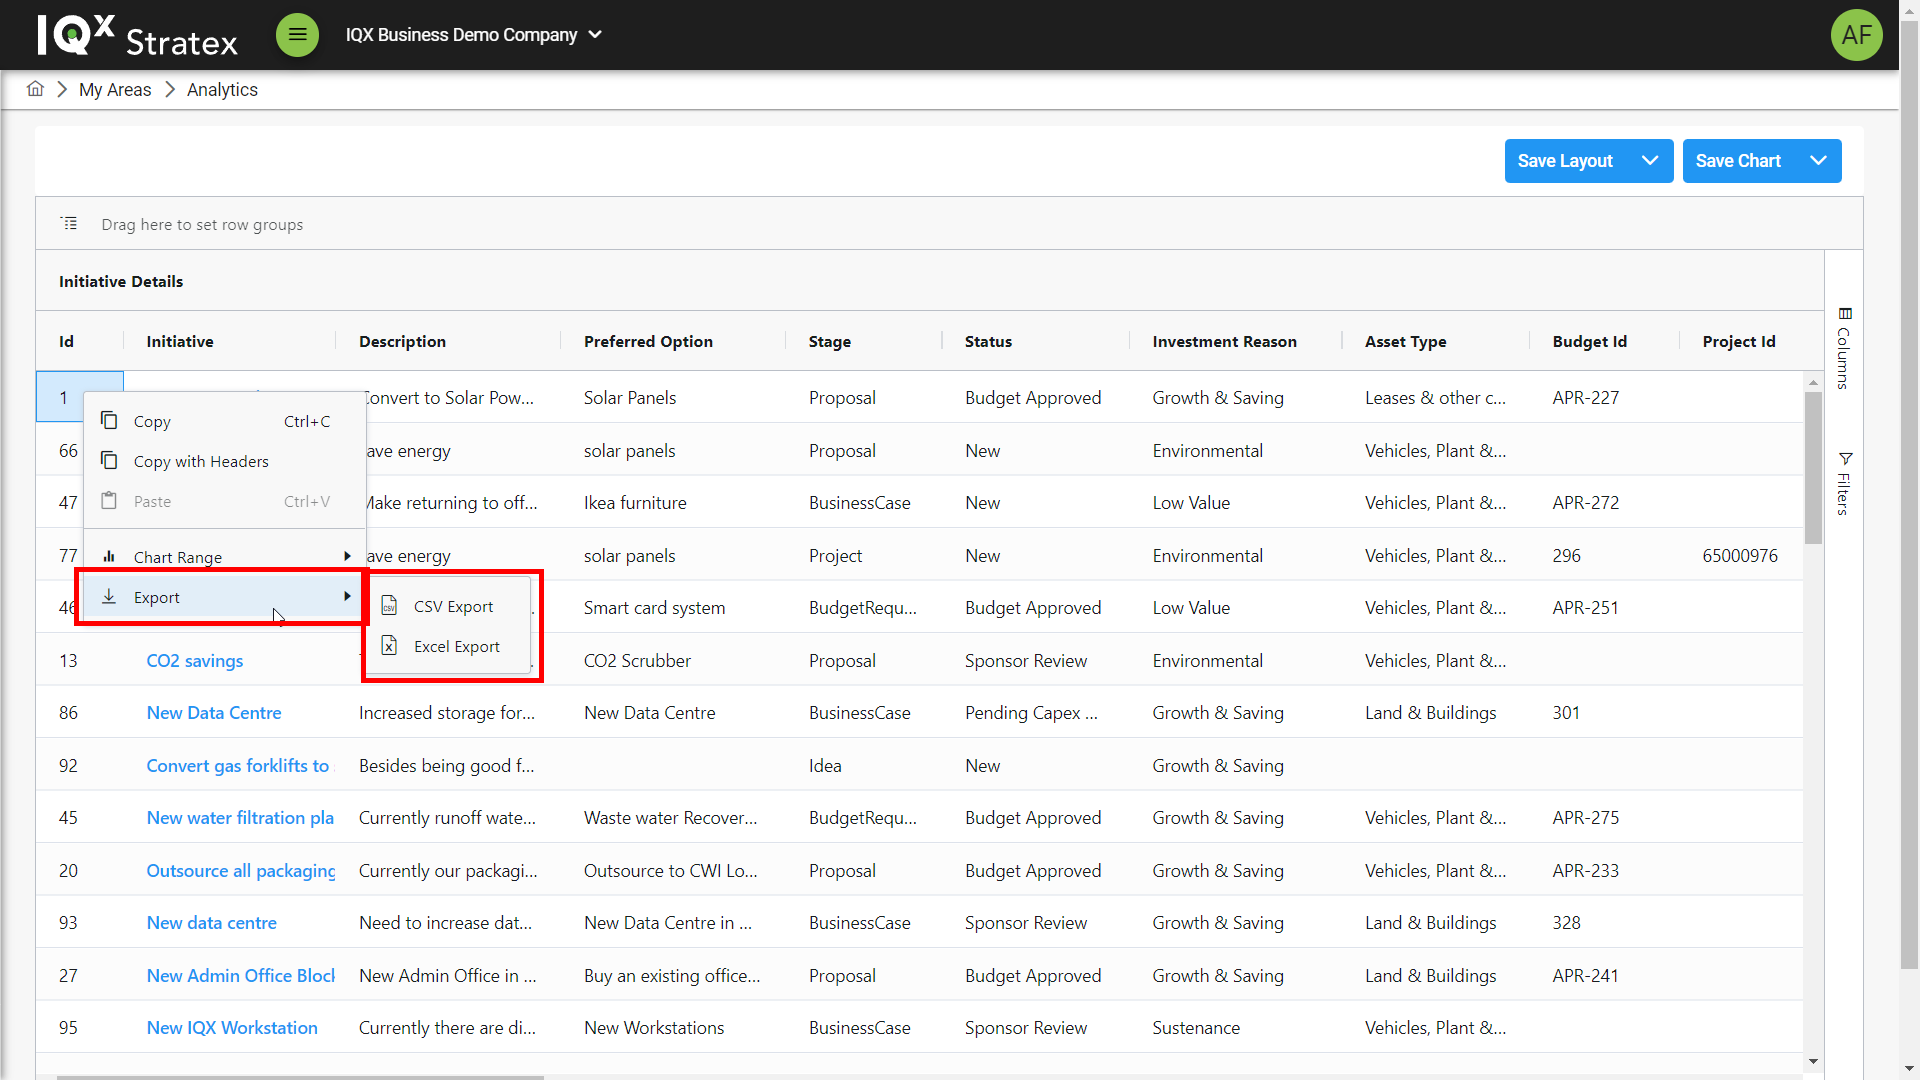
Export to Excel
The analytics table can be exported by right clicking on a data cell, clicking Export and then selecting an export format from the menu.
The data exported replicates the current layout, so it can be customised by configuring columns, using filters or loading a previously used layout.
An alternative way to export the initiative analytics data is to access the dropdown menu of the “Save Layout” button.