Analyse the financial status of initiatives to identify opportunities to refine your portfolio selection and to take mitigating actions when initiatives are veering off-course.
Key Concepts
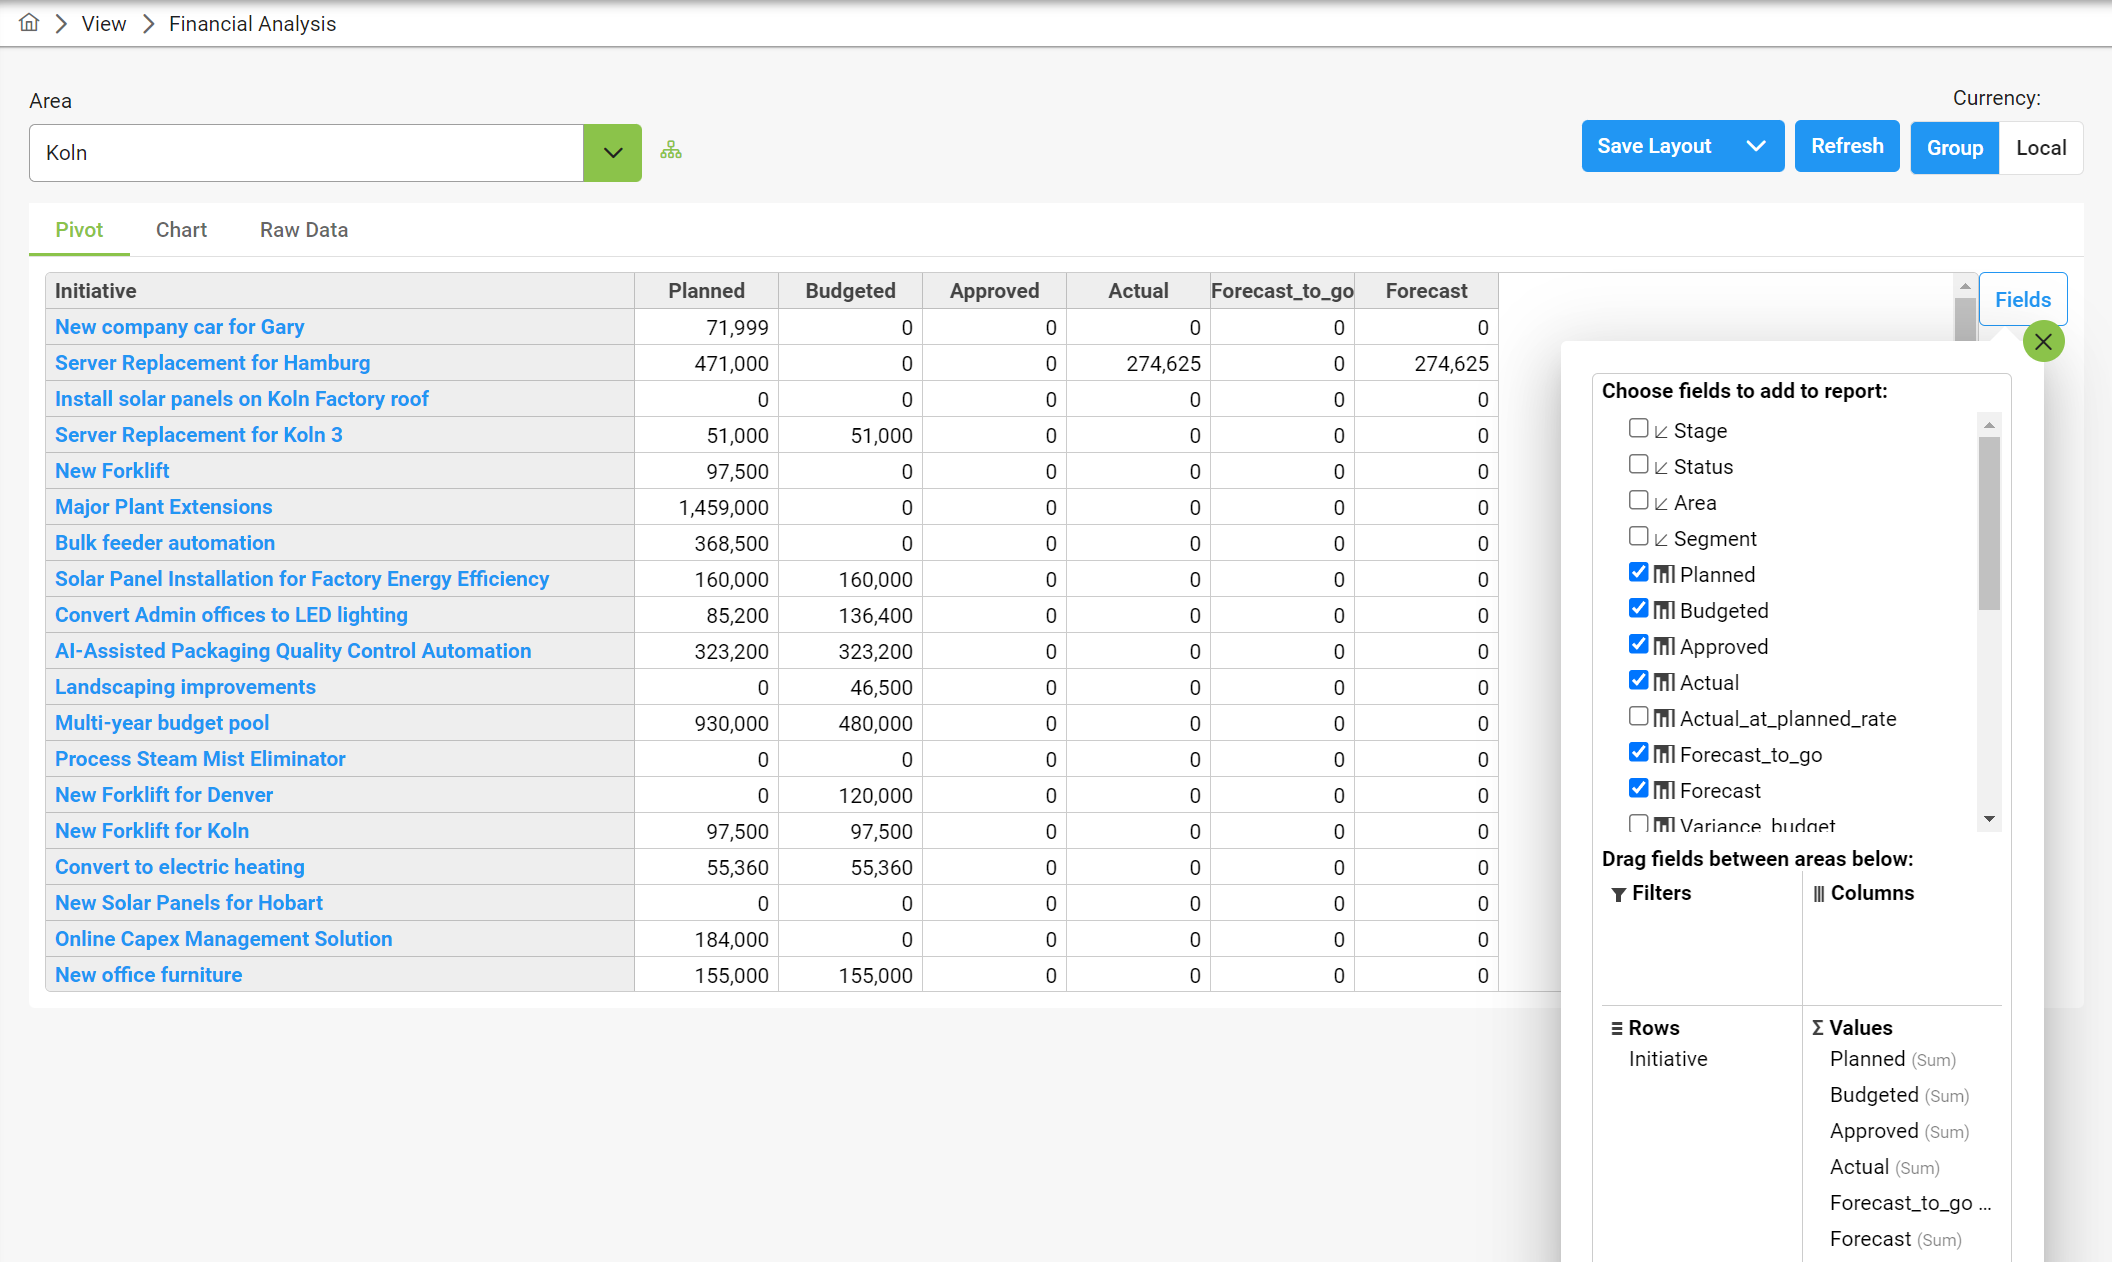
You are able to perform financial analysis on all initiatives that you are authorised to view. In general, you can see all initiatives that you are a participant of (initiator, collaborator, or approver). To see other initiatives within your Area, you require additional authorization group assignments.
Analysis within Stratex is at an initiative level. Detailed analysis of transactions is expected to be provided within your financial systems.
Stratex is a forward-looking planning tool, and the primary analysis is focussed on Forecast cost at completion. The forecast is based on Actual expenditure to date plus Forecast expenditure to go. All reported variances are calculated relative to this forecast amount.
The key figures available for analysis within Stratex are:
Planned
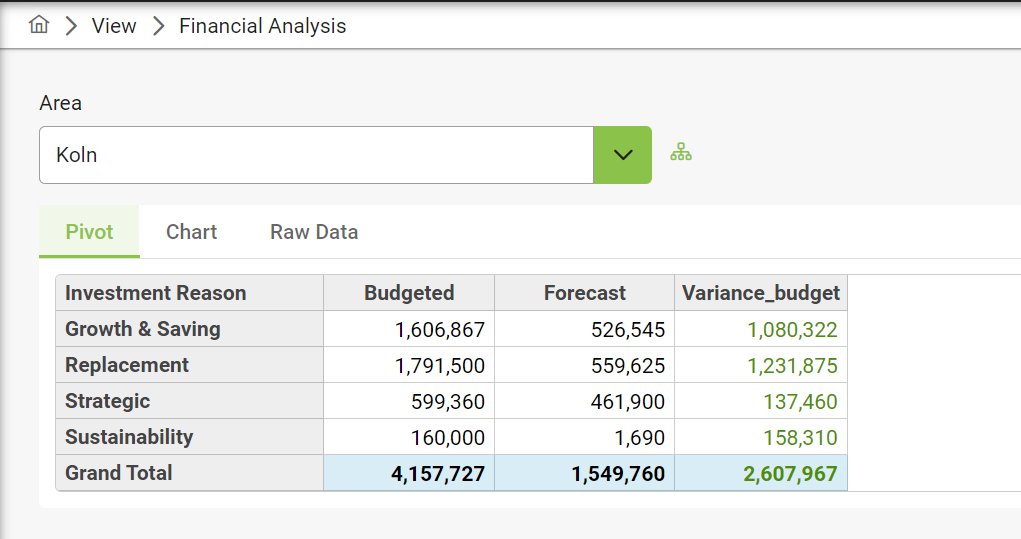
Budgeted
Approved
Actual
Forecast To Go
Forecast (Actual + Forecast)
Variance to Budget (Forecast-Budget)
Variance to Approved (Forecast-Approved)
Variance to Planned (Forecast-Planned)
Foreign Exchange Rate Variance (Actual @ Actual Rate - Actual @ Planned Rate)
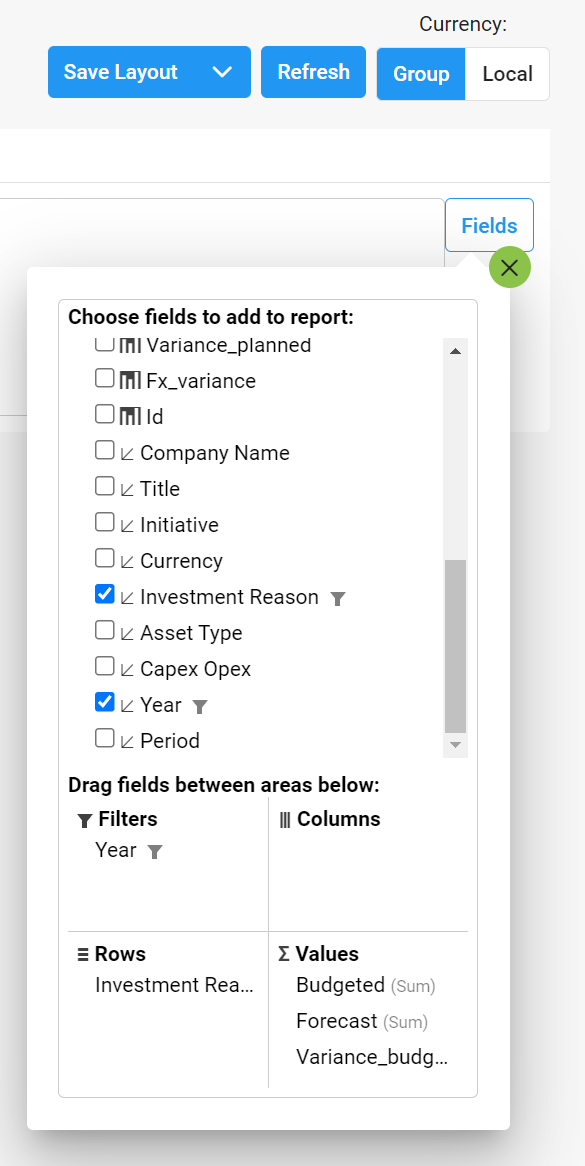
Key analysis dimensions are:
Investment Reason
Asset Type
Stage
Status
Area
Segments
Company
Initiative
Currency
Capex/Opex
Fiscal Year
Period
Financial analysis is performed at the Area level. Users can view initiatives in which the selected area is either the benefiting area or the sponsoring area.
Financial analysis can be performed in both local and group currencies.
Analysis can be performed with appropriate filtering and pivot table formatting
Filters define selection criteria (e.g. company)
Rows define the attributes to show for each project line (similar to spreadsheet columns)
Columns define the secondary dimension by which to evaluate your key figures)
Values define the key figures to be extracted
Layouts can be saved and retrieved.
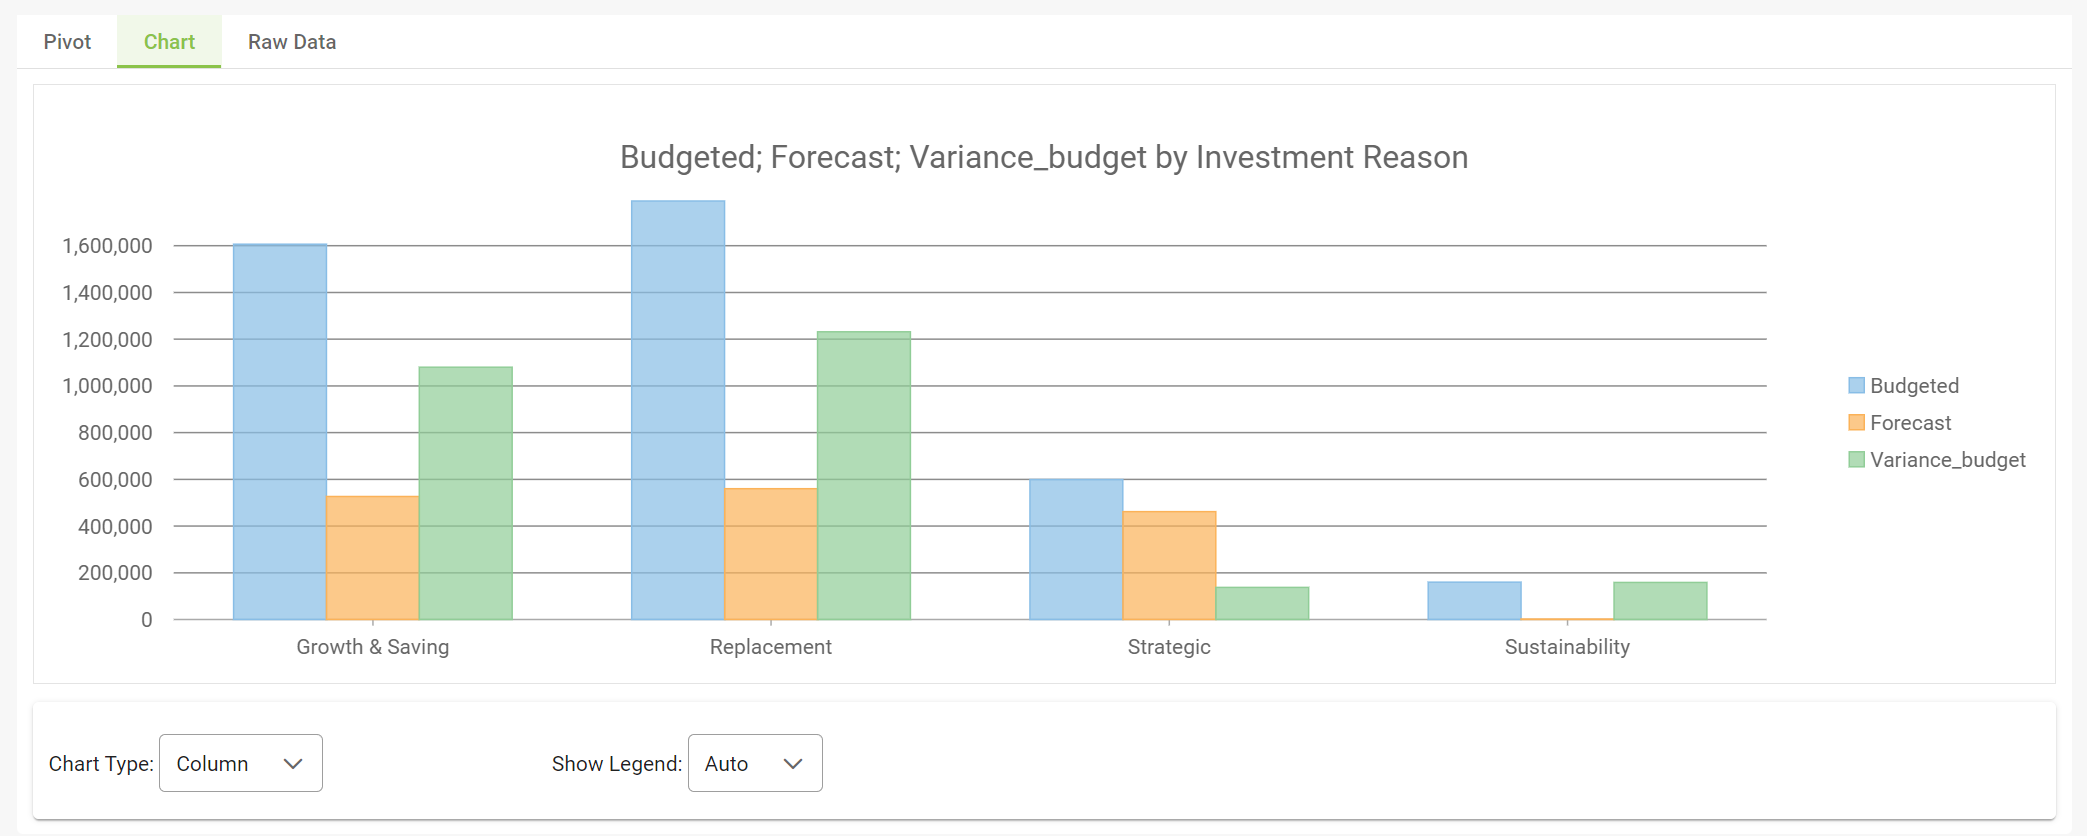
Information can be easily charted for presentation purposes.
Analysis cube raw data can be extracted on demand for further analysis and sharing off-line.
Financial analysis can be viewed for different reporting periods. These reporting periods are based on the forecast-to-go entered for each specific period.
Filters will remain in effect in the Financial Analytics transaction until the app is refreshed or the filters are cleared.
Instructions
Click View > Financial Analytics
Select your scope of area analysis. Note that the higher the analysis level, the greater the data set retrieved, which may impact data retrieval performance depending on your network speed.
Click on the Fields button to choose the key figures and dimensions you seek to analyse.
Drag & Drop fields into the layout definition as required.
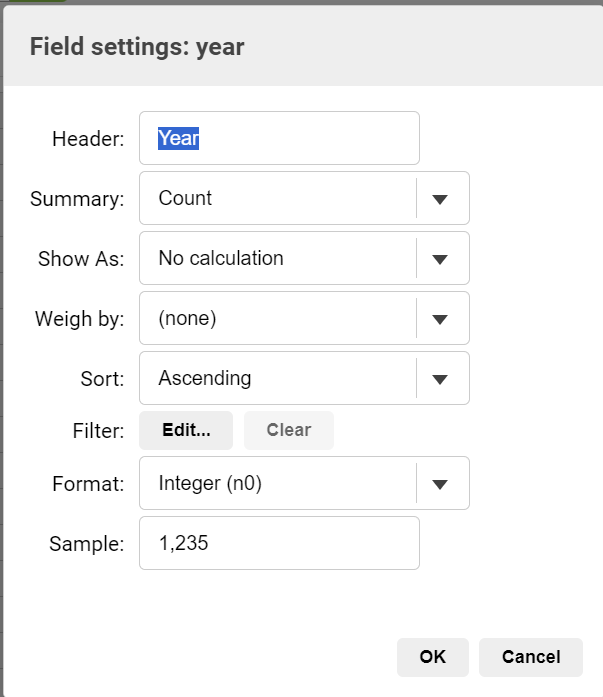
To add filter criterial to a dimension, right-click on the field and select Field Settings. Within Field Setting click Filter to choose you filter criteria.
Click Chart to view you analysis graphically. Change the Chart Type (column, bar, line, area, pie) as required.
Save your layout for future use.
By default, analytic data is presented in Group Currency. Toggle local currency to view analytics in local currency. Note that local currency reports should be filtered by local currency to ensure meaningful totals are presented.
Compare forecast versions by adding a selectable Reference Forecast and Forecast Variance column in Financial Analytics.
Users can enable or disable row subtotals using the "View Row Subtotals" checkbox.
To quickly filter by initiatives, users can search by initiative description, initiative ID, or project ID.
Data presented for analysis is limited to initiatives you are permitted to view, and may not be complete if your access permissions are limited.